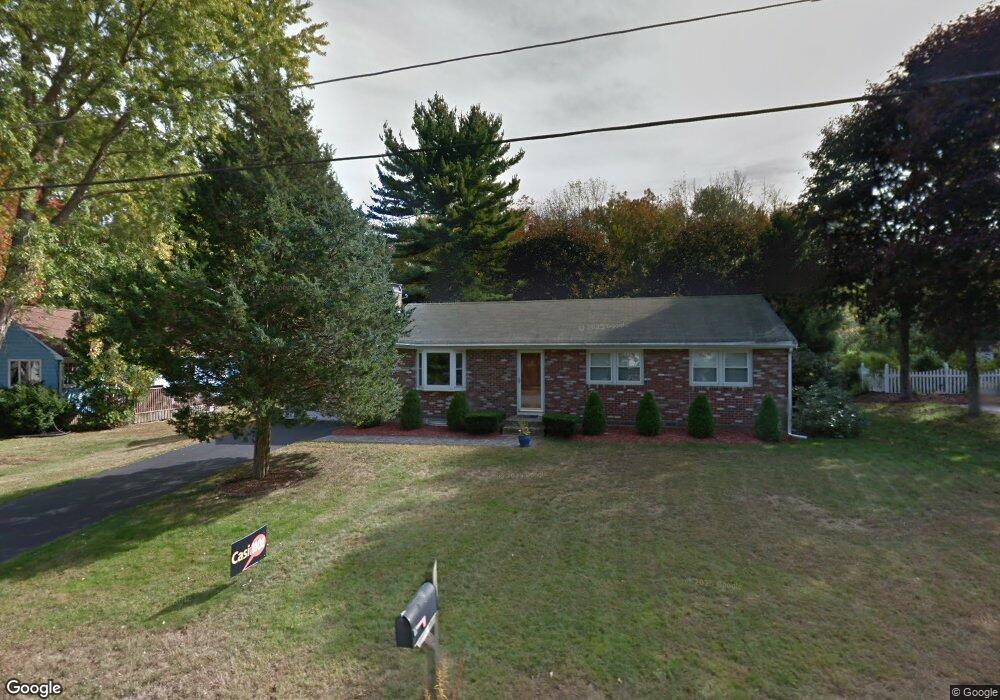
20 Dunster Rd Holliston, MA 01746
Estimated Value: $605,000 - $711,000
3
Beds
2
Baths
1,368
Sq Ft
$484/Sq Ft
Est. Value
About This Home
This home is located at 20 Dunster Rd, Holliston, MA 01746 and is currently estimated at $662,163, approximately $484 per square foot. 20 Dunster Rd is a home located in Middlesex County with nearby schools including Miller Elementary School, Robert H. Adams Middle School, and Holliston High School.
Ownership History
Date
Name
Owned For
Owner Type
Purchase Details
Closed on
Dec 18, 1998
Sold by
Macdonald Richard and Macdonald Lori
Bought by
Davis Kathryn A
Current Estimated Value
Purchase Details
Closed on
Jun 28, 1994
Sold by
20 Dunster Rd Rt and Smith Constance
Bought by
Macdonald Richard and Macdonald Lori
Create a Home Valuation Report for This Property
The Home Valuation Report is an in-depth analysis detailing your home's value as well as a comparison with similar homes in the area
Home Values in the Area
Average Home Value in this Area
Purchase History
| Date | Buyer | Sale Price | Title Company |
|---|---|---|---|
| Davis Kathryn A | $182,500 | -- | |
| Macdonald Richard | $155,000 | -- |
Source: Public Records
Mortgage History
| Date | Status | Borrower | Loan Amount |
|---|---|---|---|
| Open | Macdonald Richard | $25,000 | |
| Open | Macdonald Richard | $164,000 | |
| Closed | Macdonald Richard | $168,000 |
Source: Public Records
Tax History Compared to Growth
Tax History
| Year | Tax Paid | Tax Assessment Tax Assessment Total Assessment is a certain percentage of the fair market value that is determined by local assessors to be the total taxable value of land and additions on the property. | Land | Improvement |
|---|---|---|---|---|
| 2025 | $7,863 | $536,700 | $219,000 | $317,700 |
| 2024 | $7,081 | $470,200 | $219,000 | $251,200 |
| 2023 | $7,082 | $459,900 | $204,500 | $255,400 |
| 2022 | $6,530 | $375,700 | $204,500 | $171,200 |
| 2021 | $6,694 | $375,000 | $208,600 | $166,400 |
| 2020 | $7,461 | $395,800 | $232,200 | $163,600 |
| 2019 | $6,747 | $358,300 | $196,500 | $161,800 |
| 2018 | $6,689 | $358,300 | $196,500 | $161,800 |
| 2017 | $6,147 | $331,900 | $188,800 | $143,100 |
| 2016 | $6,000 | $319,300 | $176,200 | $143,100 |
| 2015 | $5,735 | $295,900 | $147,400 | $148,500 |
Source: Public Records
Map
Nearby Homes
- 56 Paul Rd
- 30 Arthur St
- Lot 2 Hanlon Rd
- 85 Fisher St
- 4 E Charles St
- 78 Fisher St
- 114 Walden Way Unit 114
- 4 Deerfield Rd
- 263 Chamberlain St
- 15 Broad Acres Farm Rd
- Lot 1 Florence St
- 15 Free St
- 75 Ridge Rd
- 6 Rainbow Dr
- 11 Shadowbrook Ln Unit 9
- 3 Shadowbrook Ln Unit 3
- 18 Shadowbrook Ln Unit 17
- 14 Shadowbrook Ln Unit 30
- 10 Shadowbrook Ln Unit 24
- 8 Shadowbrook Ln Unit 39