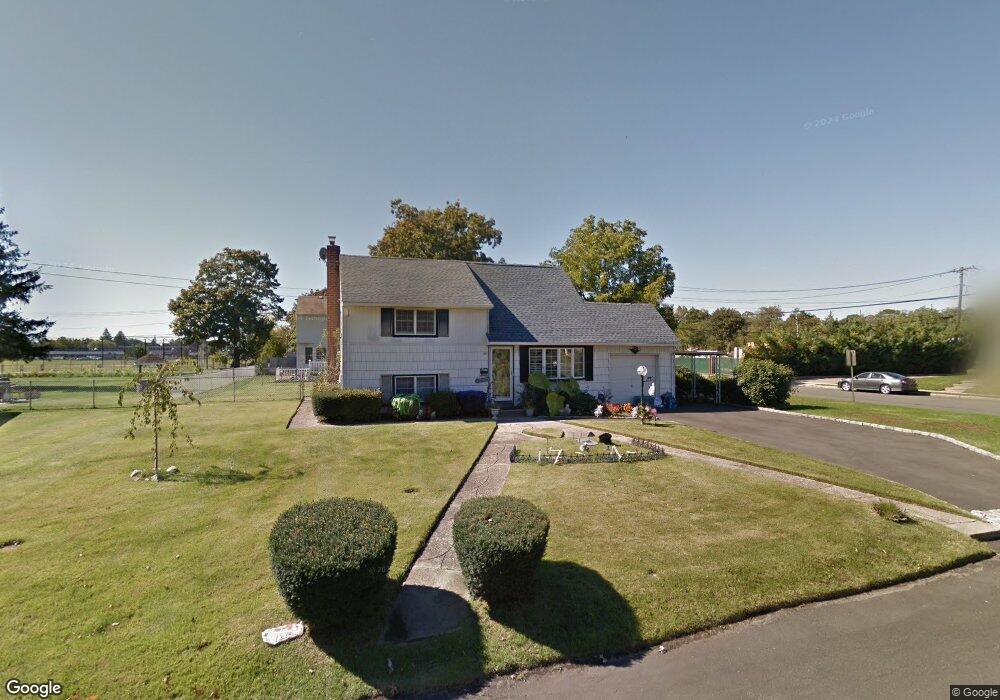
20 E 6th St Deer Park, NY 11729
Estimated Value: $600,000 - $646,000
3
Beds
2
Baths
1,617
Sq Ft
$385/Sq Ft
Est. Value
About This Home
This home is located at 20 E 6th St, Deer Park, NY 11729 and is currently estimated at $622,871, approximately $385 per square foot. 20 E 6th St is a home located in Suffolk County with nearby schools including Robert Frost Middle School, Deer Park High School, and Upper Room Christian School.
Ownership History
Date
Name
Owned For
Owner Type
Purchase Details
Closed on
Jan 26, 2018
Sold by
Grimes Kevin M and Grimes Allisonm
Bought by
Scott Nicholas and Khawaja Noreen
Current Estimated Value
Home Financials for this Owner
Home Financials are based on the most recent Mortgage that was taken out on this home.
Original Mortgage
$294,525
Outstanding Balance
$249,436
Interest Rate
3.99%
Mortgage Type
Purchase Money Mortgage
Estimated Equity
$373,435
Purchase Details
Closed on
Jan 11, 2012
Sold by
Marcellaro Francis B
Bought by
Grimes Kevin M and Grimes Allison M
Home Financials for this Owner
Home Financials are based on the most recent Mortgage that was taken out on this home.
Original Mortgage
$296,293
Interest Rate
4.25%
Mortgage Type
FHA
Purchase Details
Closed on
Dec 10, 2001
Sold by
Marinaro Bonnie
Bought by
Marcellaro Francis B
Purchase Details
Closed on
Jul 5, 1994
Sold by
Marcellaro Francis B and Marcellaro Jane
Bought by
Marinaro Bonnie
Create a Home Valuation Report for This Property
The Home Valuation Report is an in-depth analysis detailing your home's value as well as a comparison with similar homes in the area
Home Values in the Area
Average Home Value in this Area
Purchase History
| Date | Buyer | Sale Price | Title Company |
|---|---|---|---|
| Scott Nicholas | $353,000 | -- | |
| Grimes Kevin M | $304,000 | -- | |
| Marcellaro Francis B | -- | Commonwealth Land Title Ins | |
| Marinaro Bonnie | -- | -- |
Source: Public Records
Mortgage History
| Date | Status | Borrower | Loan Amount |
|---|---|---|---|
| Open | Scott Nicholas | $294,525 | |
| Previous Owner | Grimes Kevin M | $296,293 |
Source: Public Records
Tax History
| Year | Tax Paid | Tax Assessment Tax Assessment Total Assessment is a certain percentage of the fair market value that is determined by local assessors to be the total taxable value of land and additions on the property. | Land | Improvement |
|---|---|---|---|---|
| 2024 | $11,368 | $3,320 | $450 | $2,870 |
| 2023 | $11,368 | $3,320 | $450 | $2,870 |
| 2022 | $9,876 | $3,320 | $450 | $2,870 |
| 2021 | $9,876 | $3,320 | $450 | $2,870 |
| 2020 | $10,437 | $3,320 | $450 | $2,870 |
| 2019 | $10,437 | $0 | $0 | $0 |
| 2018 | $8,701 | $3,320 | $450 | $2,870 |
| 2017 | $8,701 | $3,320 | $450 | $2,870 |
| 2016 | $8,648 | $3,320 | $450 | $2,870 |
| 2015 | -- | $3,320 | $450 | $2,870 |
| 2014 | -- | $3,320 | $450 | $2,870 |
Source: Public Records
Map
Nearby Homes
- 35 E 5th St
- 30 E 6th St
- 33 E 5th St
- 29 E 6th St
- 29 E 6th St
- 38 E 6th St
- 39 E 6th St
- 59 Golden Ave Unit A1
- 59 Golden Ave Unit A4
- 59 Golden Ave Unit A2
- 59 Golden Ave Unit A01
- 59 Golden Ave
- 55 Golden Ave Unit B03
- 55 Golden Ave Unit B3
- 55 Golden Ave Unit B4
- 55 Golden Ave Unit B01
- 55 Golden Ave Unit B02
- 55 Golden Ave Unit B04
- 55 Golden Ave Unit B2
- 55 Golden Ave
Your Personal Tour Guide
Ask me questions while you tour the home.