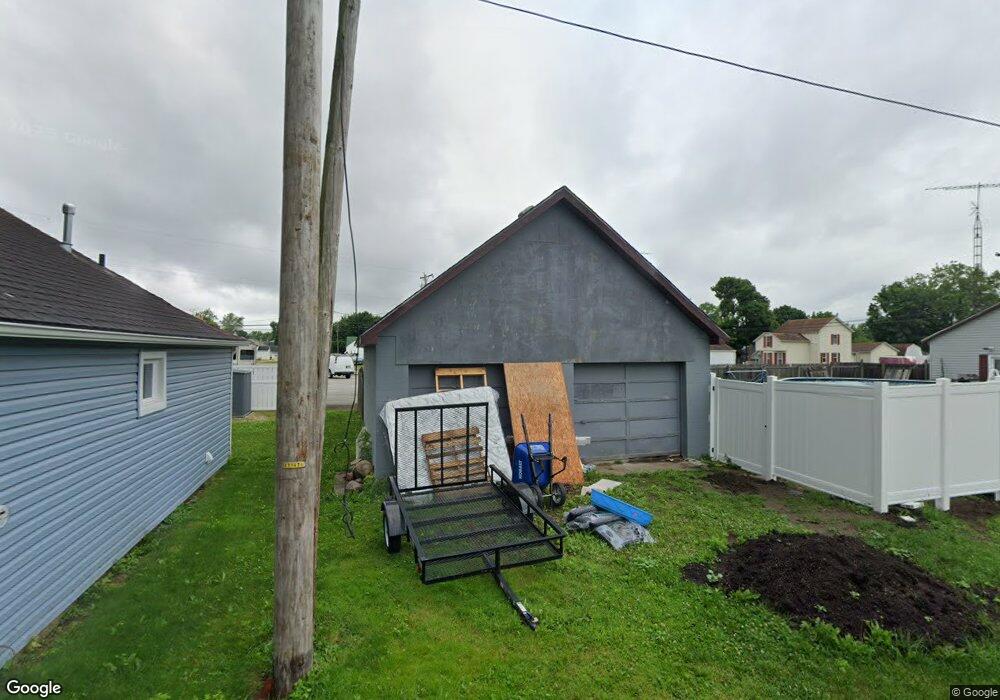
20 E Main St Phillipsburg, OH 45354
Estimated Value: $62,000 - $149,000
2
Beds
1
Bath
1,092
Sq Ft
$80/Sq Ft
Est. Value
About This Home
This home is located at 20 E Main St, Phillipsburg, OH 45354 and is currently estimated at $87,221, approximately $79 per square foot. 20 E Main St is a home located in Montgomery County with nearby schools including Union Elementary School and Northmont High School.
Ownership History
Date
Name
Owned For
Owner Type
Purchase Details
Closed on
Feb 20, 2023
Sold by
Peters Gary Lamar and Peters Lavonne Deane
Bought by
Markley Allen and Markley Donna
Current Estimated Value
Purchase Details
Closed on
May 25, 2021
Sold by
Waverly Estates Llc
Bought by
Peters Gary Lamar and Peters Lavonne Deane
Purchase Details
Closed on
Apr 25, 2018
Sold by
U S Bank Na
Bought by
Waverly Estates Llc
Purchase Details
Closed on
Mar 20, 2018
Sold by
Isaacs Kellie
Bought by
Us Bank Na and Structured Asset Securities Corporation
Purchase Details
Closed on
Apr 18, 2002
Sold by
Morris Victoria and Webb Victoria
Bought by
Isaacs Kellie
Home Financials for this Owner
Home Financials are based on the most recent Mortgage that was taken out on this home.
Original Mortgage
$65,467
Interest Rate
7.18%
Mortgage Type
FHA
Create a Home Valuation Report for This Property
The Home Valuation Report is an in-depth analysis detailing your home's value as well as a comparison with similar homes in the area
Purchase History
| Date | Buyer | Sale Price | Title Company |
|---|---|---|---|
| Markley Allen | $135,000 | None Listed On Document | |
| Peters Gary Lamar | $40,000 | Vantage Land Title | |
| Waverly Estates Llc | $20,080 | None Available | |
| Us Bank Na | $36,180 | None Available | |
| Isaacs Kellie | $66,000 | -- |
Source: Public Records
Mortgage History
| Date | Status | Borrower | Loan Amount |
|---|---|---|---|
| Previous Owner | Isaacs Kellie | $65,467 |
Source: Public Records
Tax History
| Year | Tax Paid | Tax Assessment Tax Assessment Total Assessment is a certain percentage of the fair market value that is determined by local assessors to be the total taxable value of land and additions on the property. | Land | Improvement |
|---|---|---|---|---|
| 2025 | $1,906 | $22,490 | $5,940 | $16,550 |
| 2024 | $1,787 | $22,490 | $5,940 | $16,550 |
| 2023 | $1,787 | $22,490 | $5,940 | $16,550 |
| 2022 | $1,732 | $15,950 | $4,210 | $11,740 |
| 2021 | $1,685 | $15,950 | $4,210 | $11,740 |
| 2020 | $1,674 | $15,950 | $4,210 | $11,740 |
| 2019 | $1,852 | $16,430 | $4,210 | $12,220 |
| 2018 | $1,823 | $16,430 | $4,210 | $12,220 |
| 2017 | $1,833 | $16,430 | $4,210 | $12,220 |
| 2016 | $1,864 | $14,400 | $4,210 | $10,190 |
| 2015 | $1,197 | $14,400 | $4,210 | $10,190 |
| 2014 | $1,197 | $14,400 | $4,210 | $10,190 |
| 2012 | -- | $14,460 | $4,020 | $10,440 |
Source: Public Records
Map
Nearby Homes
- 11031 N Montgomery County Line Rd
- 6617 Sweet Potato Ridge Rd
- 8375 N Montgomery County Line Rd
- 8686 National Rd
- 10983 Haber Rd
- 0 Haber Rd Unit 25497952
- 7415 Pleasant Plain Rd
- 8492 Wellbaum Rd
- 4407 Sweet Potato Ridge Rd
- 122 Springhouse Dr
- 100 Fitchburg Farm Dr
- 7827 S Jay Rd
- 5700 Swan Dr
- Alt State Route 49 Alt 49 State Route 49
- 6543 Brookville Salem Rd
- 7501 S Brookstone Place
- 4205 Sweet Potato Ridge Rd
- 149 Irongate Dr
- 112 Irongate Dr
- 0000 Ludenn Ln
Your Personal Tour Guide
Ask me questions while you tour the home.