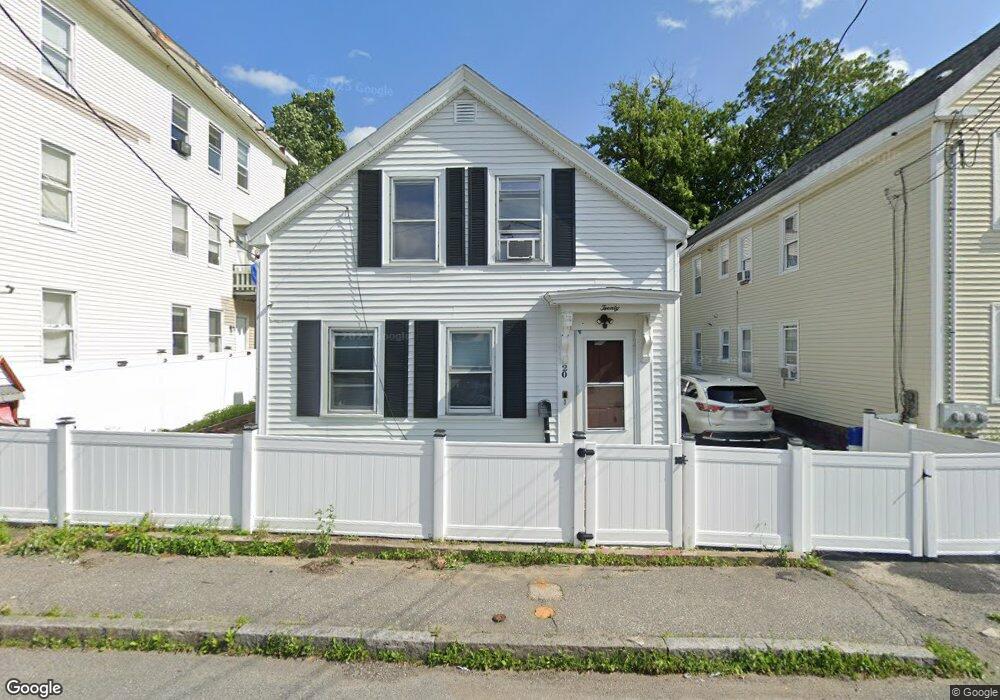
20 E Pine St Lowell, MA 01851
Lower Highlands NeighborhoodEstimated Value: $394,615 - $475,000
3
Beds
1
Bath
1,412
Sq Ft
$309/Sq Ft
Est. Value
About This Home
This home is located at 20 E Pine St, Lowell, MA 01851 and is currently estimated at $435,904, approximately $308 per square foot. 20 E Pine St is a home located in Middlesex County with nearby schools including Charles W. Morey Elementary School, Abraham Lincoln Elementary School, and Charlotte M. Murkland Elementary School.
Ownership History
Date
Name
Owned For
Owner Type
Purchase Details
Closed on
May 13, 2025
Sold by
Phapakdy Vichith and Phapakdy Somemay
Bought by
Phapakdy Ft and Phapakdy
Current Estimated Value
Purchase Details
Closed on
Jun 10, 1994
Sold by
State Street B&T
Bought by
Phothisen Cliff
Purchase Details
Closed on
Apr 6, 1994
Sold by
Phapakdy Vichith
Bought by
State St B&T
Purchase Details
Closed on
Jun 13, 1988
Sold by
Vasquez Jose A
Bought by
Phapaddy Vichith
Home Financials for this Owner
Home Financials are based on the most recent Mortgage that was taken out on this home.
Original Mortgage
$84,000
Interest Rate
10.21%
Mortgage Type
Purchase Money Mortgage
Create a Home Valuation Report for This Property
The Home Valuation Report is an in-depth analysis detailing your home's value as well as a comparison with similar homes in the area
Home Values in the Area
Average Home Value in this Area
Purchase History
| Date | Buyer | Sale Price | Title Company |
|---|---|---|---|
| Phapakdy Ft | -- | None Available | |
| Phapakdy Ft | -- | None Available | |
| Phothisen Cliff | $37,000 | -- | |
| Phothisen Cliff | $37,000 | -- | |
| State St B&T | $30,279 | -- | |
| State St B & T | $30,279 | -- | |
| Phapaddy Vichith | $105,000 | -- |
Source: Public Records
Mortgage History
| Date | Status | Borrower | Loan Amount |
|---|---|---|---|
| Previous Owner | Phapaddy Vichith | $25,000 | |
| Previous Owner | Phapaddy Vichith | $84,000 |
Source: Public Records
Tax History
| Year | Tax Paid | Tax Assessment Tax Assessment Total Assessment is a certain percentage of the fair market value that is determined by local assessors to be the total taxable value of land and additions on the property. | Land | Improvement |
|---|---|---|---|---|
| 2025 | $3,829 | $333,500 | $109,800 | $223,700 |
| 2024 | $3,735 | $313,600 | $102,600 | $211,000 |
| 2023 | $3,520 | $283,400 | $89,200 | $194,200 |
| 2022 | $3,098 | $244,100 | $70,500 | $173,600 |
| 2021 | $2,893 | $214,900 | $61,300 | $153,600 |
| 2020 | $2,770 | $207,300 | $61,300 | $146,000 |
| 2019 | $2,561 | $182,400 | $58,300 | $124,100 |
| 2018 | $2,504 | $174,000 | $55,500 | $118,500 |
| 2017 | $2,478 | $166,100 | $53,800 | $112,300 |
| 2016 | $2,318 | $152,900 | $50,000 | $102,900 |
| 2015 | $2,251 | $145,400 | $50,000 | $95,400 |
| 2013 | $2,139 | $142,500 | $60,000 | $82,500 |
Source: Public Records
Map
Nearby Homes
- 143 Westford St
- 68 Smith St
- 45 Marshall St
- 3 Butman Place
- 15 Barclay St
- 1017 Middlesex St Unit 5
- 30 Grace St
- 491 Dutton St Unit 305
- 491 Dutton St Unit 409
- 491 Dutton St Unit 504
- 201 Thorndike St Unit 501
- 201 Thorndike St Unit 2-312
- 201 Thorndike St Unit 505
- 191 Thorndike St Unit 26
- 84 Cambridge St
- 18 Burgess St
- 710 School St
- 67 S Loring St
- 11 Warwick St Unit 3
- 312 Wilder St
Your Personal Tour Guide
Ask me questions while you tour the home.