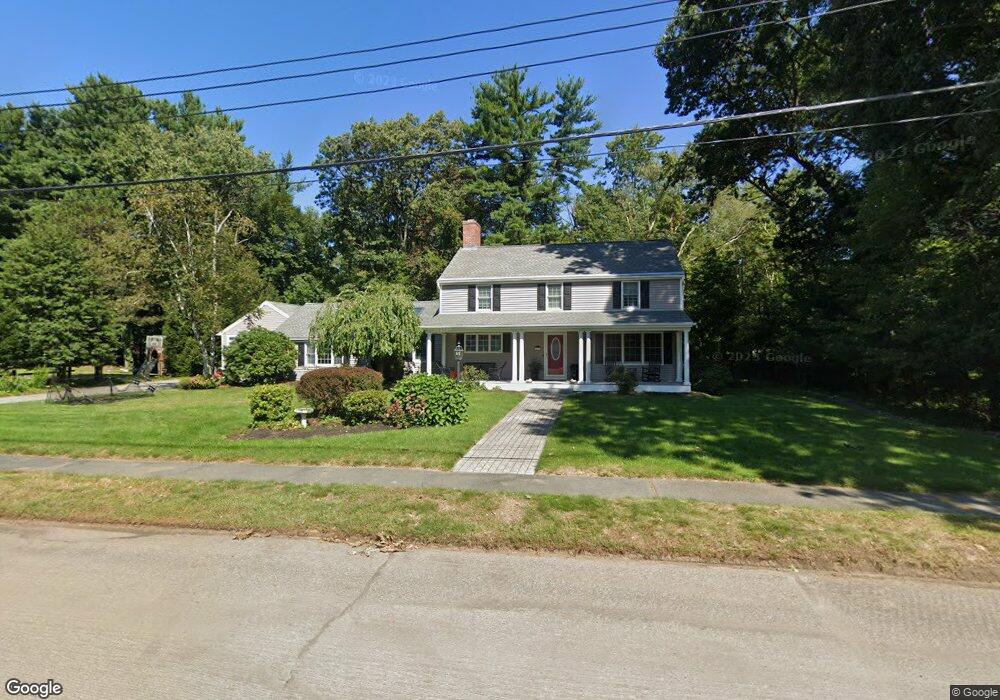
20 Eastway Reading, MA 01867
Estimated Value: $1,440,842 - $1,597,000
4
Beds
4
Baths
4,076
Sq Ft
$372/Sq Ft
Est. Value
About This Home
This home is located at 20 Eastway, Reading, MA 01867 and is currently estimated at $1,516,211, approximately $371 per square foot. 20 Eastway is a home located in Middlesex County with nearby schools including Wood End Elementary School, Arthur W. Coolidge Middle School, and Reading Memorial High School.
Ownership History
Date
Name
Owned For
Owner Type
Purchase Details
Closed on
Jun 7, 2010
Sold by
Lusk Martin
Bought by
Lusk Janet
Current Estimated Value
Home Financials for this Owner
Home Financials are based on the most recent Mortgage that was taken out on this home.
Original Mortgage
$60,000
Outstanding Balance
$40,232
Interest Rate
4.98%
Estimated Equity
$1,475,979
Purchase Details
Closed on
Jan 31, 1997
Sold by
Cann John W
Bought by
Lusk Martin and Lusk Janet
Create a Home Valuation Report for This Property
The Home Valuation Report is an in-depth analysis detailing your home's value as well as a comparison with similar homes in the area
Home Values in the Area
Average Home Value in this Area
Purchase History
| Date | Buyer | Sale Price | Title Company |
|---|---|---|---|
| Lusk Janet | -- | -- | |
| Lusk Martin | $311,666 | -- |
Source: Public Records
Mortgage History
| Date | Status | Borrower | Loan Amount |
|---|---|---|---|
| Open | Lusk Martin | $60,000 | |
| Previous Owner | Lusk Martin | $390,000 |
Source: Public Records
Tax History
| Year | Tax Paid | Tax Assessment Tax Assessment Total Assessment is a certain percentage of the fair market value that is determined by local assessors to be the total taxable value of land and additions on the property. | Land | Improvement |
|---|---|---|---|---|
| 2025 | $14,789 | $1,298,400 | $595,100 | $703,300 |
| 2024 | $14,975 | $1,277,700 | $585,400 | $692,300 |
| 2023 | $14,135 | $1,122,700 | $512,900 | $609,800 |
| 2022 | $14,138 | $1,060,600 | $483,800 | $576,800 |
| 2021 | $13,543 | $980,700 | $442,700 | $538,000 |
| 2020 | $12,528 | $898,100 | $420,900 | $477,200 |
| 2019 | $12,030 | $845,400 | $395,500 | $449,900 |
| 2018 | $10,995 | $792,700 | $370,100 | $422,600 |
| 2017 | $10,911 | $777,700 | $362,900 | $414,800 |
| 2016 | $10,997 | $758,400 | $329,300 | $429,100 |
| 2015 | $10,212 | $694,700 | $300,700 | $394,000 |
| 2014 | $9,616 | $652,400 | $297,700 | $354,700 |
Source: Public Records
Map
Nearby Homes
- 32 Granger Ave
- 11 Clover Cir Unit A
- 16 Briarwood Ave
- 43 Ashley Place
- 119 Van Norden Rd
- 0 Charles St Unit 72374573
- 50 Forest St
- 194 Sanborn Ln
- 27 Audubon Rd
- 36 Main St Unit 1
- 28 Nutter Rd
- 141 Belmont St
- 10 Meadow Brook Ln
- 35 Longfellow Rd
- 99 Grove St
- 17 Marshall St
- 150 Grove St
- 41 Winter St
- 4 Hickory Ln
- 114 Haverhill St
Your Personal Tour Guide
Ask me questions while you tour the home.