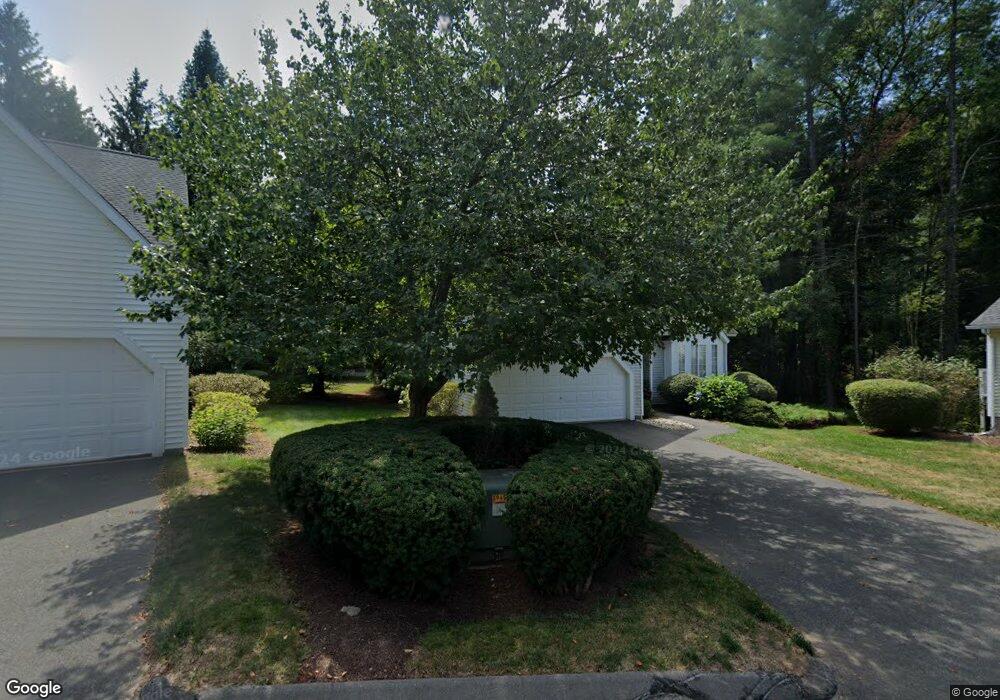
20 Edgewood Ct Simsbury, CT 06070
Estimated Value: $386,000 - $442,000
2
Beds
3
Baths
1,592
Sq Ft
$259/Sq Ft
Est. Value
About This Home
This home is located at 20 Edgewood Ct, Simsbury, CT 06070 and is currently estimated at $412,188, approximately $258 per square foot. 20 Edgewood Ct is a home located in Hartford County with nearby schools including Central School, Henry James Memorial School, and Simsbury High School.
Ownership History
Date
Name
Owned For
Owner Type
Purchase Details
Closed on
Nov 3, 2003
Sold by
Primavera Dennis J and Primavera Patricia L
Bought by
Armstrong Cheeneah M
Current Estimated Value
Home Financials for this Owner
Home Financials are based on the most recent Mortgage that was taken out on this home.
Original Mortgage
$240,000
Outstanding Balance
$111,651
Interest Rate
6.05%
Estimated Equity
$300,537
Purchase Details
Closed on
Oct 30, 1995
Sold by
Deresh Zory and Deresh Asya
Bought by
Primavera Patricia and Primavera Dennis
Home Financials for this Owner
Home Financials are based on the most recent Mortgage that was taken out on this home.
Original Mortgage
$170,100
Interest Rate
6.88%
Mortgage Type
Unknown
Purchase Details
Closed on
Oct 6, 1993
Sold by
Ct Dev Group Inc
Bought by
Rabinovich Asya and Deresh Zory
Home Financials for this Owner
Home Financials are based on the most recent Mortgage that was taken out on this home.
Original Mortgage
$140,000
Interest Rate
6.9%
Mortgage Type
Unknown
Create a Home Valuation Report for This Property
The Home Valuation Report is an in-depth analysis detailing your home's value as well as a comparison with similar homes in the area
Home Values in the Area
Average Home Value in this Area
Purchase History
| Date | Buyer | Sale Price | Title Company |
|---|---|---|---|
| Armstrong Cheeneah M | $300,000 | -- | |
| Primavera Patricia | $189,000 | -- | |
| Rabinovich Asya | $178,200 | -- |
Source: Public Records
Mortgage History
| Date | Status | Borrower | Loan Amount |
|---|---|---|---|
| Open | Rabinovich Asya | $240,000 | |
| Previous Owner | Rabinovich Asya | $167,800 | |
| Previous Owner | Rabinovich Asya | $170,100 | |
| Previous Owner | Rabinovich Asya | $140,000 |
Source: Public Records
Tax History Compared to Growth
Tax History
| Year | Tax Paid | Tax Assessment Tax Assessment Total Assessment is a certain percentage of the fair market value that is determined by local assessors to be the total taxable value of land and additions on the property. | Land | Improvement |
|---|---|---|---|---|
| 2025 | $8,202 | $240,100 | $0 | $240,100 |
| 2024 | $7,998 | $240,100 | $0 | $240,100 |
| 2023 | $7,640 | $240,100 | $0 | $240,100 |
| 2022 | $6,377 | $165,080 | $0 | $165,080 |
| 2021 | $6,377 | $165,080 | $0 | $165,080 |
| 2020 | $6,123 | $165,080 | $0 | $165,080 |
| 2019 | $6,161 | $165,080 | $0 | $165,080 |
| 2018 | $6,205 | $165,080 | $0 | $165,080 |
| 2017 | $6,067 | $156,530 | $0 | $156,530 |
| 2016 | $5,810 | $156,530 | $0 | $156,530 |
| 2015 | $5,810 | $156,530 | $0 | $156,530 |
| 2014 | $5,814 | $156,530 | $0 | $156,530 |
Source: Public Records
Map
Nearby Homes
- 16 Stratton Forest Way
- 40 Firetown Rd Unit 39
- 3 Stebbins Brook Ln
- 4 Stebbins Brook Ln
- 1 West St Unit 206
- 48 Library Ln Unit 48
- 18 Meadowlark Rd
- 15 Sand Hill Rd
- 25 Barry Ln
- 308 Hopmeadow St
- 15 Pinnacle Mountain Rd
- 301 Bushy Hill Rd
- 26 Winterset Ln
- 3 Cobtail Way
- 10 Sachems Trail
- 9 Cobtail Way
- 324 Firetown Rd
- 9 Gretel Ln
- 8 Quorn Hunt Rd
- 3 Minister Brook Dr
- 28 Edgewood Ct
- 26 Edgewood Ct
- 24 Edgewood Ct
- 22 Edgewood Ct
- 18 Edgewood Ct
- 16 Edgewood Ct
- 14 Edgewood Ct
- 12 Edgewood Ct
- 10 Edgewood Ct
- 8 Edgewood Ct
- 6 Edgewood Ct
- 2 Edgewood Ct
- 8 Edgewood Ct Unit 8
- 18 Edgewood Ct Unit 18
- 2 Edgewood Ct Unit 2
- 26 Edgewood Ct Unit 26
- 14 Edgewood Ct Unit 14
- 45 Farms Village Rd
- 22 Southbridge Ct
- 4 Southbridge Ct