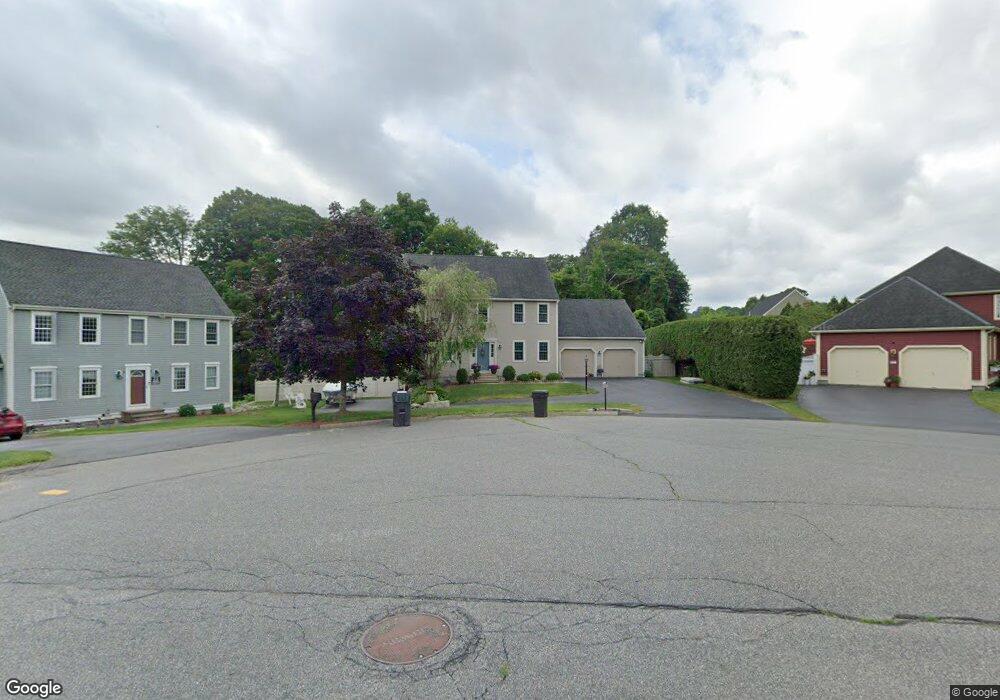
20 Eseks Cir South Grafton, MA 01560
Estimated Value: $733,000 - $839,000
4
Beds
3
Baths
2,514
Sq Ft
$308/Sq Ft
Est. Value
About This Home
This home is located at 20 Eseks Cir, South Grafton, MA 01560 and is currently estimated at $773,130, approximately $307 per square foot. 20 Eseks Cir is a home located in Worcester County with nearby schools including Grafton High School and Assumption School.
Ownership History
Date
Name
Owned For
Owner Type
Purchase Details
Closed on
Aug 12, 2025
Sold by
Perez Melanie J
Bought by
Melanie J Perez Ret2025 J and Melanie Perez
Current Estimated Value
Purchase Details
Closed on
Jul 1, 2004
Sold by
Sirva Relocation Llc
Bought by
Blum Melanie Jo
Purchase Details
Closed on
Oct 17, 2003
Sold by
Bibeault John R
Bought by
Bibeault John R and Bibeault Lisa F
Purchase Details
Closed on
Jun 19, 2002
Sold by
Brady Stephen H and Crain-Brady Wanda J
Bought by
Bibeault John R
Purchase Details
Closed on
Dec 21, 1998
Sold by
Art Lot Acres Dev Corp
Bought by
Brady Stephen H and Brady Wanda J
Create a Home Valuation Report for This Property
The Home Valuation Report is an in-depth analysis detailing your home's value as well as a comparison with similar homes in the area
Home Values in the Area
Average Home Value in this Area
Purchase History
| Date | Buyer | Sale Price | Title Company |
|---|---|---|---|
| Melanie J Perez Ret2025 J | -- | -- | |
| Melanie J Perez Ret2025 J | -- | -- | |
| Blum Melanie Jo | $450,000 | -- | |
| Sirva Relocation Llc | $457,000 | -- | |
| Blum Melanie Jo | $450,000 | -- | |
| Blum Melanie Jo | $450,000 | -- | |
| Blum Melanie Jo | $450,000 | -- | |
| Sirva Relocation Llc | $457,000 | -- | |
| Sirva Relocation Llc | $457,000 | -- | |
| Bibeault John R | -- | -- | |
| Bibeault John R | -- | -- | |
| Bibeault John R | -- | -- | |
| Bibeault John R | -- | -- | |
| Bibeault John R | $413,265 | -- | |
| Bibeault John R | $413,265 | -- | |
| Brady Stephen H | $286,775 | -- | |
| Brady Stephen H | $286,775 | -- |
Source: Public Records
Mortgage History
| Date | Status | Borrower | Loan Amount |
|---|---|---|---|
| Previous Owner | Brady Stephen H | $245,000 | |
| Previous Owner | Brady Stephen H | $255,000 |
Source: Public Records
Tax History Compared to Growth
Tax History
| Year | Tax Paid | Tax Assessment Tax Assessment Total Assessment is a certain percentage of the fair market value that is determined by local assessors to be the total taxable value of land and additions on the property. | Land | Improvement |
|---|---|---|---|---|
| 2025 | $9,627 | $690,600 | $206,200 | $484,400 |
| 2024 | $9,246 | $646,100 | $187,900 | $458,200 |
| 2023 | $8,812 | $560,900 | $187,900 | $373,000 |
| 2022 | $8,221 | $487,000 | $161,300 | $325,700 |
| 2021 | $7,980 | $464,500 | $146,700 | $317,800 |
| 2020 | $7,552 | $457,700 | $146,700 | $311,000 |
| 2019 | $7,514 | $451,000 | $145,100 | $305,900 |
| 2018 | $7,248 | $436,900 | $128,800 | $308,100 |
| 2017 | $7,041 | $429,300 | $121,200 | $308,100 |
| 2016 | $6,713 | $400,800 | $140,500 | $260,300 |
| 2015 | $6,587 | $399,200 | $140,500 | $258,700 |
| 2014 | $5,712 | $374,300 | $128,800 | $245,500 |
Source: Public Records
Map
Nearby Homes
- 185 Main St
- 7 B Herbert Dr Unit 14
- 115 Ariel Cir
- 150 Ariel Cir
- 7 Pine Hill Rd
- 50 Highland View Dr
- 29 Highland View Dr
- 109 Main St
- 110 Main St
- 58 Fisherville Terrace
- 55 Fisherville Terrace
- 44 Fisherville Terrace
- 19 Wildflower Dr
- 20 Millers Way Unit C
- 5 Wildflower Dr
- 7 Millers Way Unit C
- 11 Coldspring Dr Unit B
- 90 Leland Hill Rd
- 29 Sampson St Unit 29
- 24 Coldspring Dr Unit B