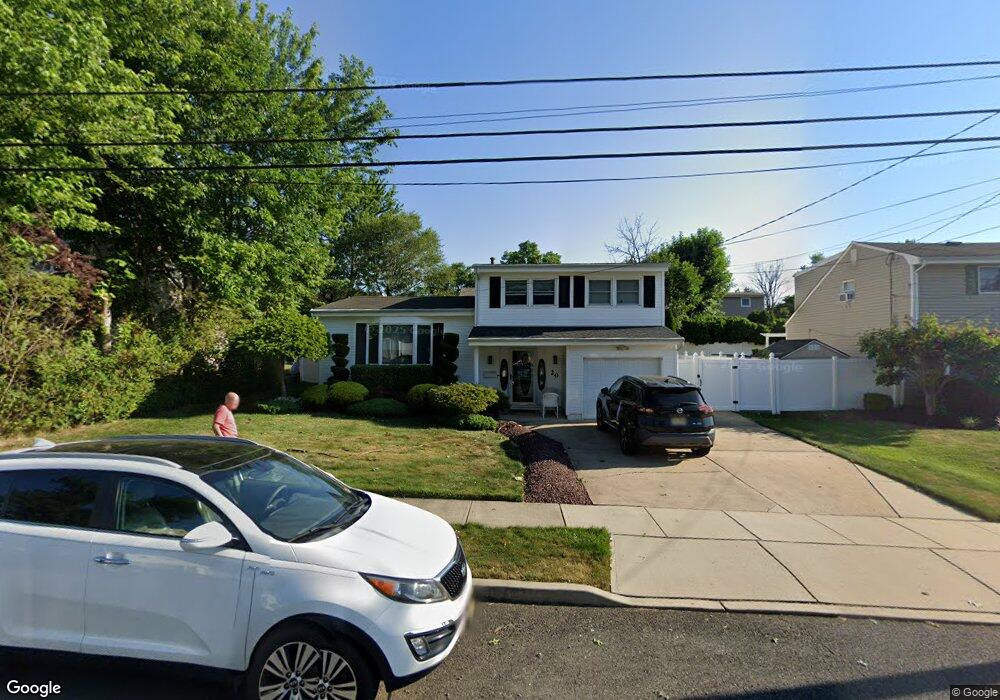
20 Exeter St Old Bridge, NJ 08857
Estimated Value: $573,540 - $662,000
Studio
--
Bath
1,529
Sq Ft
$409/Sq Ft
Est. Value
About This Home
This home is located at 20 Exeter St, Old Bridge, NJ 08857 and is currently estimated at $624,635, approximately $408 per square foot. 20 Exeter St is a home located in Middlesex County with nearby schools including Old Bridge High School, St. Ambrose School, and Calvary Christian School.
Ownership History
Date
Name
Owned For
Owner Type
Purchase Details
Closed on
Jun 21, 2000
Sold by
Giordano John
Bought by
Wissner Richard and Wissner Lori
Current Estimated Value
Home Financials for this Owner
Home Financials are based on the most recent Mortgage that was taken out on this home.
Original Mortgage
$96,900
Outstanding Balance
$35,061
Interest Rate
8.59%
Estimated Equity
$589,574
Purchase Details
Closed on
May 19, 1995
Sold by
Landi Gennaro
Bought by
Chan Ingrid and Giordano John
Home Financials for this Owner
Home Financials are based on the most recent Mortgage that was taken out on this home.
Original Mortgage
$123,000
Interest Rate
8.34%
Create a Home Valuation Report for This Property
The Home Valuation Report is an in-depth analysis detailing your home's value as well as a comparison with similar homes in the area
Home Values in the Area
Average Home Value in this Area
Purchase History
| Date | Buyer | Sale Price | Title Company |
|---|---|---|---|
| Wissner Richard | $196,900 | -- | |
| Chan Ingrid | $153,000 | -- |
Source: Public Records
Mortgage History
| Date | Status | Borrower | Loan Amount |
|---|---|---|---|
| Open | Wissner Richard | $96,900 | |
| Previous Owner | Chan Ingrid | $123,000 |
Source: Public Records
Tax History
| Year | Tax Paid | Tax Assessment Tax Assessment Total Assessment is a certain percentage of the fair market value that is determined by local assessors to be the total taxable value of land and additions on the property. | Land | Improvement |
|---|---|---|---|---|
| 2025 | $8,533 | $151,100 | $69,200 | $81,900 |
| 2024 | $8,185 | $151,100 | $69,200 | $81,900 |
Source: Public Records
Map
Nearby Homes
- 26 Exeter St
- 27 Mabaline Rd
- 109 Throckmorton Ln
- 11 Lincroft Ave
- 16 Twain Ave
- 50 Creighton Cir
- 5 Harold St
- 52 Gaub Rd
- 18 Grace Dr
- 25 Morsell Place
- 18 Bruce St
- 21 Warren Dr
- 26 Front Ct
- 236 Community Cir
- 50 Victory Ct
- 20 Valley Vale Dr
- 119 Nightingale Ct
- 1732 New Jersey 18
- 0-0 By Palmer Bridge
- 1800 New Jersey 18
Your Personal Tour Guide
Ask me questions while you tour the home.