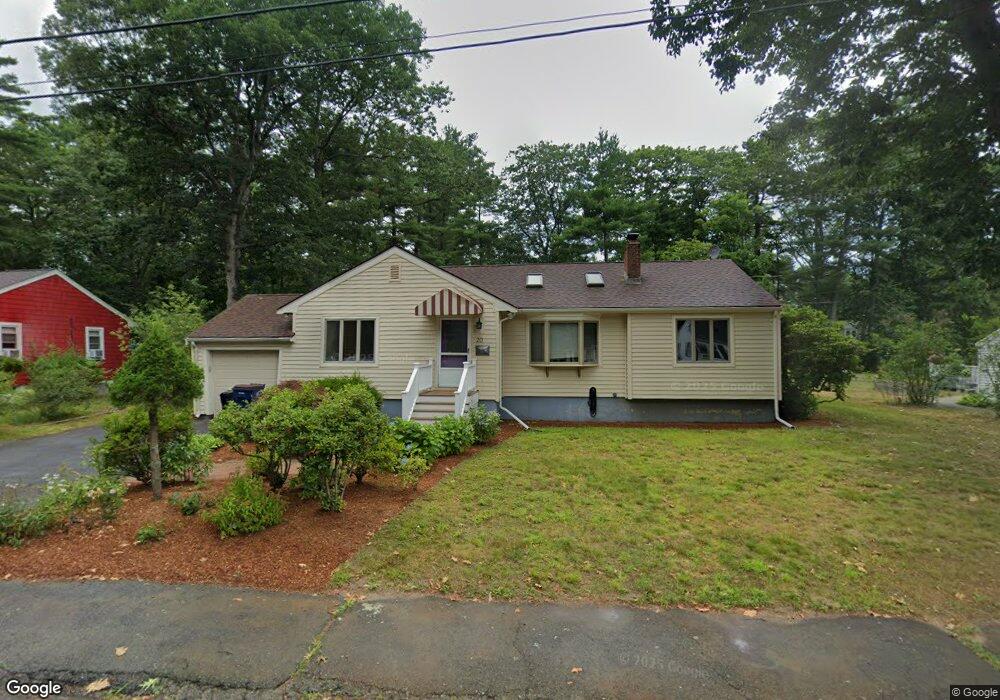
20 Francis Rd Sharon, MA 02067
Estimated Value: $669,522 - $721,000
3
Beds
2
Baths
1,485
Sq Ft
$465/Sq Ft
Est. Value
About This Home
This home is located at 20 Francis Rd, Sharon, MA 02067 and is currently estimated at $690,381, approximately $464 per square foot. 20 Francis Rd is a home located in Norfolk County with nearby schools including Heights Elementary School, Sharon Middle School, and Sharon High School.
Ownership History
Date
Name
Owned For
Owner Type
Purchase Details
Closed on
Nov 17, 2000
Sold by
Lichtman Gene J and Lichtman Donna
Bought by
Zelfond Jeffrey and Zelfond Dina
Current Estimated Value
Purchase Details
Closed on
Sep 12, 1997
Sold by
Levitan Robert A and Levitan Shari A
Bought by
Lichtman Gene J and Lichtman Donna
Create a Home Valuation Report for This Property
The Home Valuation Report is an in-depth analysis detailing your home's value as well as a comparison with similar homes in the area
Home Values in the Area
Average Home Value in this Area
Purchase History
| Date | Buyer | Sale Price | Title Company |
|---|---|---|---|
| Zelfond Jeffrey | $268,000 | -- | |
| Lichtman Gene J | $190,000 | -- |
Source: Public Records
Mortgage History
| Date | Status | Borrower | Loan Amount |
|---|---|---|---|
| Open | Lichtman Gene J | $244,000 | |
| Closed | Lichtman Gene J | $257,700 |
Source: Public Records
Tax History Compared to Growth
Tax History
| Year | Tax Paid | Tax Assessment Tax Assessment Total Assessment is a certain percentage of the fair market value that is determined by local assessors to be the total taxable value of land and additions on the property. | Land | Improvement |
|---|---|---|---|---|
| 2025 | $9,458 | $541,100 | $356,500 | $184,600 |
| 2024 | $9,077 | $516,300 | $327,000 | $189,300 |
| 2023 | $8,875 | $477,400 | $305,600 | $171,800 |
| 2022 | $8,550 | $432,900 | $254,700 | $178,200 |
| 2021 | $8,452 | $413,700 | $240,300 | $173,400 |
| 2020 | $7,860 | $413,700 | $240,300 | $173,400 |
| 2019 | $7,306 | $376,400 | $212,600 | $163,800 |
| 2018 | $7,211 | $372,300 | $208,500 | $163,800 |
| 2017 | $7,036 | $358,600 | $194,800 | $163,800 |
| 2016 | $6,924 | $344,300 | $194,800 | $149,500 |
| 2015 | $6,457 | $318,100 | $178,700 | $139,400 |
| 2014 | $5,976 | $290,800 | $162,500 | $128,300 |
Source: Public Records
Map
Nearby Homes
- 28 Norfolk Place
- 27 Henry St
- 111 E Foxboro St
- 148 S Main St
- 5 Trowel Pond Shop Rd Unit C
- 137 Pond St
- 150 Pond St
- 16 Forest Rd
- 54 Depot St
- 29 Station St
- 630 S Main St
- 277 Everett St
- 49 Cottage St
- 32 Billings St Unit A
- 180 Old Post Rd Unit 202
- 180 Old Post Rd Unit 206
- 180 Old Post Rd Unit 201
- 180 Old Post Rd Unit 207
- 668 S Main St
- 15 Paul Revere Rd