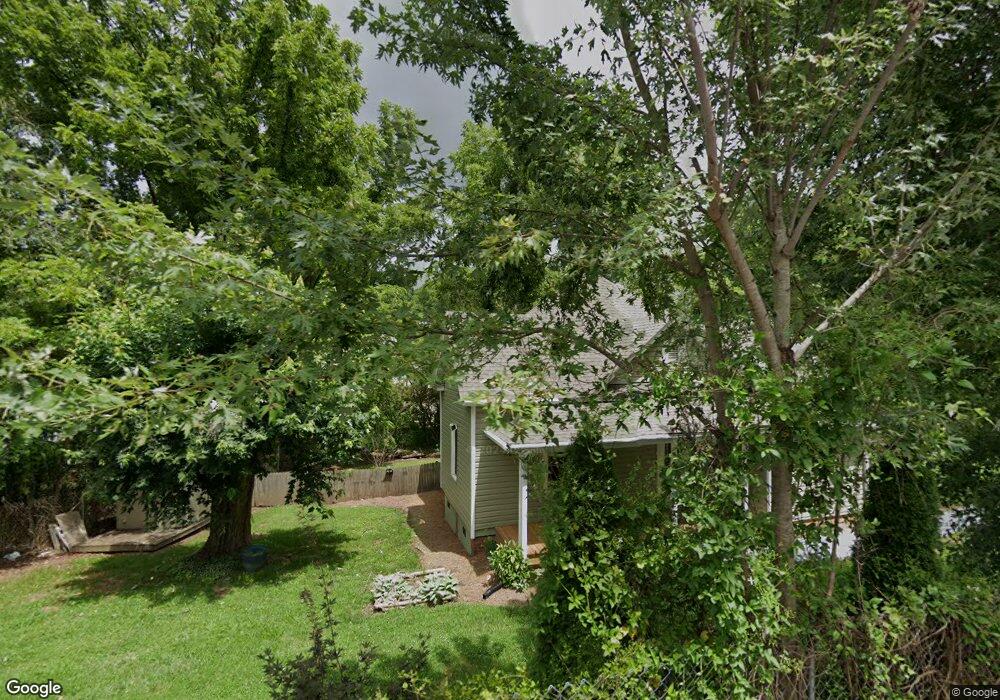
20 Frank St Canton, NC 28716
Estimated Value: $267,000 - $355,000
2
Beds
2
Baths
868
Sq Ft
$345/Sq Ft
Est. Value
About This Home
This home is located at 20 Frank St, Canton, NC 28716 and is currently estimated at $299,842, approximately $345 per square foot. 20 Frank St is a home located in Haywood County with nearby schools including North Canton Elementary School, Canton Middle, and Pisgah High School.
Ownership History
Date
Name
Owned For
Owner Type
Purchase Details
Closed on
Jan 28, 2025
Sold by
Kirkpatrick James W
Bought by
Owenby Angelique Rain and Sharlow Eric Allen
Current Estimated Value
Home Financials for this Owner
Home Financials are based on the most recent Mortgage that was taken out on this home.
Original Mortgage
$319,191
Outstanding Balance
$317,272
Interest Rate
6.85%
Mortgage Type
New Conventional
Estimated Equity
-$17,430
Purchase Details
Closed on
Jun 14, 2023
Sold by
Watkins Betty G
Bought by
Watkins Christopher
Purchase Details
Closed on
Mar 14, 2000
Bought by
Watkins Dennis C
Create a Home Valuation Report for This Property
The Home Valuation Report is an in-depth analysis detailing your home's value as well as a comparison with similar homes in the area
Home Values in the Area
Average Home Value in this Area
Purchase History
| Date | Buyer | Sale Price | Title Company |
|---|---|---|---|
| Owenby Angelique Rain | $630 | None Listed On Document | |
| Watkins Christopher | -- | None Listed On Document | |
| Watkins Christopher | -- | None Listed On Document | |
| Watkins Dennis C | -- | -- |
Source: Public Records
Mortgage History
| Date | Status | Borrower | Loan Amount |
|---|---|---|---|
| Open | Owenby Angelique Rain | $319,191 |
Source: Public Records
Tax History
| Year | Tax Paid | Tax Assessment Tax Assessment Total Assessment is a certain percentage of the fair market value that is determined by local assessors to be the total taxable value of land and additions on the property. | Land | Improvement |
|---|---|---|---|---|
| 2025 | -- | $132,300 | $25,500 | $106,800 |
| 2024 | $6 | $78,200 | $25,700 | $52,500 |
| 2023 | $589 | $78,200 | $25,700 | $52,500 |
| 2022 | $577 | $78,200 | $25,700 | $52,500 |
| 2021 | $577 | $78,200 | $25,700 | $52,500 |
| 2020 | $492 | $57,000 | $20,200 | $36,800 |
| 2019 | $497 | $57,000 | $20,200 | $36,800 |
| 2018 | $497 | $57,000 | $20,200 | $36,800 |
| 2017 | $497 | $57,000 | $0 | $0 |
| 2016 | $475 | $55,000 | $0 | $0 |
| 2015 | $475 | $55,000 | $0 | $0 |
| 2014 | $390 | $55,000 | $0 | $0 |
Source: Public Records
Map
Nearby Homes