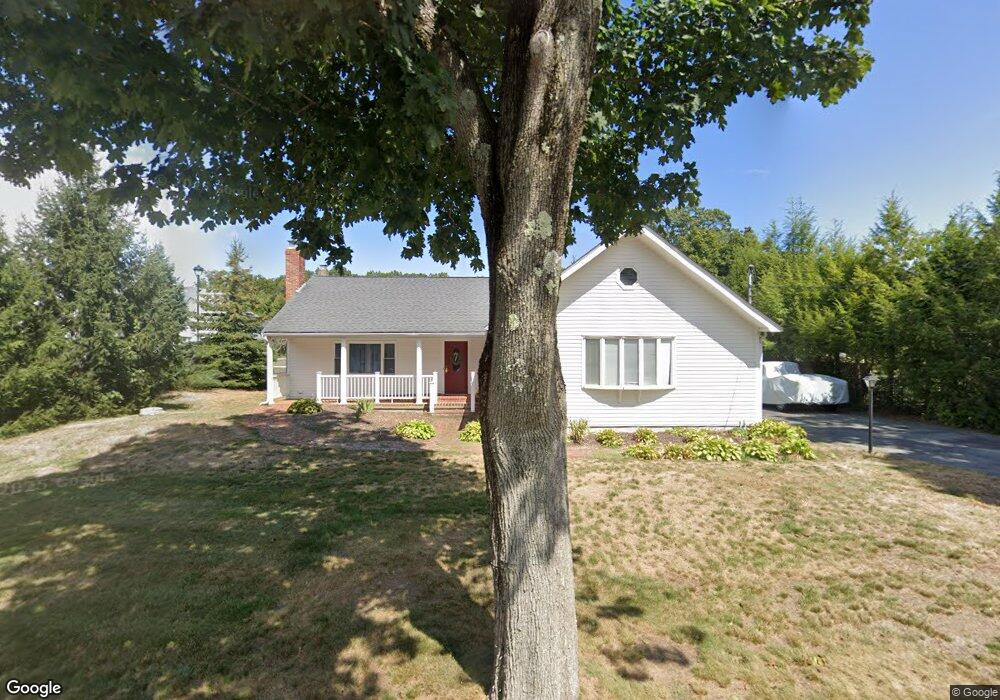
20 Free St Hingham, MA 02043
Estimated Value: $1,184,180
3
Beds
2
Baths
2,466
Sq Ft
$480/Sq Ft
Est. Value
About This Home
This home is located at 20 Free St, Hingham, MA 02043 and is currently estimated at $1,184,180, approximately $480 per square foot. 20 Free St is a home located in Plymouth County with nearby schools including East Elementary School, Hingham Middle School, and Hingham High School.
Ownership History
Date
Name
Owned For
Owner Type
Purchase Details
Closed on
Nov 29, 2004
Sold by
Healey Mark W and Healey Robin D
Bought by
South Shore Bapt Chrch
Current Estimated Value
Purchase Details
Closed on
Feb 28, 2002
Sold by
Decola Joseph W and Decola Melissa
Bought by
Healey Mark W and Healey Robin D
Purchase Details
Closed on
Sep 22, 1998
Sold by
Murray Childrens T and Mcmenimon Marjorie
Bought by
Decola Joseph and Decola Melissa
Purchase Details
Closed on
Dec 30, 1993
Sold by
Mayer Janet M
Bought by
Abena Shores Rt and Murray Suzanne J
Create a Home Valuation Report for This Property
The Home Valuation Report is an in-depth analysis detailing your home's value as well as a comparison with similar homes in the area
Purchase History
| Date | Buyer | Sale Price | Title Company |
|---|---|---|---|
| South Shore Bapt Chrch | $620,000 | -- | |
| Healey Mark W | $450,000 | -- | |
| Decola Joseph | $249,500 | -- | |
| Abena Shores Rt | $245,000 | -- |
Source: Public Records
Mortgage History
| Date | Status | Borrower | Loan Amount |
|---|---|---|---|
| Open | Abena Shores Rt | $3,000,000 | |
| Previous Owner | Abena Shores Rt | $75,000 | |
| Previous Owner | Abena Shores Rt | $410,000 |
Source: Public Records
Tax History
| Year | Tax Paid | Tax Assessment Tax Assessment Total Assessment is a certain percentage of the fair market value that is determined by local assessors to be the total taxable value of land and additions on the property. | Land | Improvement |
|---|---|---|---|---|
| 2025 | -- | $877,000 | $505,800 | $371,200 |
| 2024 | -- | $849,400 | $505,800 | $343,600 |
| 2023 | $0 | $841,000 | $505,800 | $335,200 |
| 2022 | $0 | $677,300 | $421,500 | $255,800 |
| 2021 | $0 | $647,600 | $421,500 | $226,100 |
| 2020 | $0 | $647,600 | $421,500 | $226,100 |
| 2019 | $0 | $634,900 | $421,500 | $213,400 |
| 2018 | $533 | $609,500 | $421,500 | $188,000 |
| 2017 | $548 | $614,800 | $421,500 | $193,300 |
| 2016 | -- | $594,600 | $401,300 | $193,300 |
| 2015 | -- | $575,100 | $381,800 | $193,300 |
Source: Public Records
Map
Nearby Homes
Your Personal Tour Guide
Ask me questions while you tour the home.