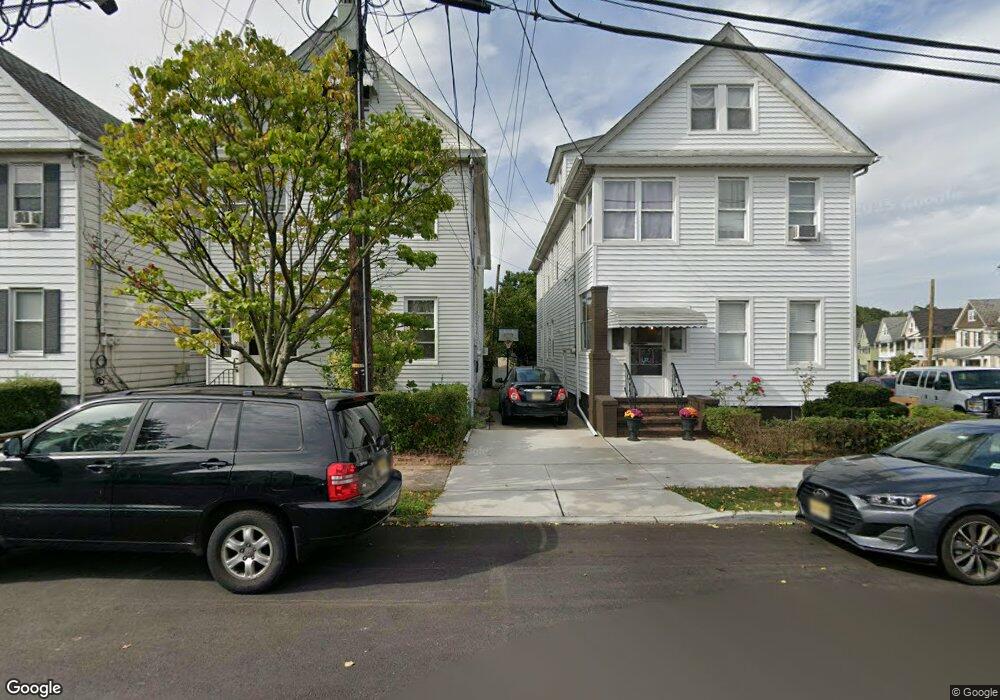
20 Freeman St Unit 1 New Brunswick, NJ 08901
Estimated Value: $518,188 - $727,000
3
Beds
1
Bath
2,234
Sq Ft
$282/Sq Ft
Est. Value
About This Home
This home is located at 20 Freeman St Unit 1, New Brunswick, NJ 08901 and is currently estimated at $630,297, approximately $282 per square foot. 20 Freeman St Unit 1 is a home located in Middlesex County with nearby schools including New Brunswick High School and Central Jersey College Prep Charter School.
Ownership History
Date
Name
Owned For
Owner Type
Purchase Details
Closed on
Mar 11, 2019
Sold by
Rasmussen Matthew D and The Estate Of John Samok Sr
Bought by
Samok John
Current Estimated Value
Purchase Details
Closed on
Oct 7, 2003
Sold by
Cseh Sandor
Bought by
Samok John
Purchase Details
Closed on
Jul 21, 1994
Sold by
Weiser John
Bought by
Cseh Sandor
Home Financials for this Owner
Home Financials are based on the most recent Mortgage that was taken out on this home.
Original Mortgage
$67,000
Interest Rate
8.25%
Create a Home Valuation Report for This Property
The Home Valuation Report is an in-depth analysis detailing your home's value as well as a comparison with similar homes in the area
Home Values in the Area
Average Home Value in this Area
Purchase History
| Date | Buyer | Sale Price | Title Company |
|---|---|---|---|
| Samok John | -- | None Available | |
| Samok John | $300,000 | -- | |
| Cseh Sandor | $146,000 | -- |
Source: Public Records
Mortgage History
| Date | Status | Borrower | Loan Amount |
|---|---|---|---|
| Previous Owner | Cseh Sandor | $67,000 |
Source: Public Records
Tax History Compared to Growth
Tax History
| Year | Tax Paid | Tax Assessment Tax Assessment Total Assessment is a certain percentage of the fair market value that is determined by local assessors to be the total taxable value of land and additions on the property. | Land | Improvement |
|---|---|---|---|---|
| 2025 | $8,598 | $328,300 | $109,000 | $219,300 |
| 2024 | $8,349 | $328,300 | $109,000 | $219,300 |
| 2023 | $8,349 | $328,300 | $109,000 | $219,300 |
| 2022 | $8,171 | $328,300 | $109,000 | $219,300 |
| 2021 | $6,062 | $328,300 | $109,000 | $219,300 |
| 2020 | $8,109 | $328,300 | $109,000 | $219,300 |
| 2019 | $7,955 | $328,300 | $109,000 | $219,300 |
| 2018 | $7,774 | $328,300 | $109,000 | $219,300 |
| 2017 | $8,300 | $376,000 | $109,000 | $267,000 |
| 2016 | $8,318 | $141,800 | $30,800 | $111,000 |
| 2015 | $7,869 | $141,800 | $30,800 | $111,000 |
| 2014 | $7,725 | $141,800 | $30,800 | $111,000 |
Source: Public Records
Map
Nearby Homes