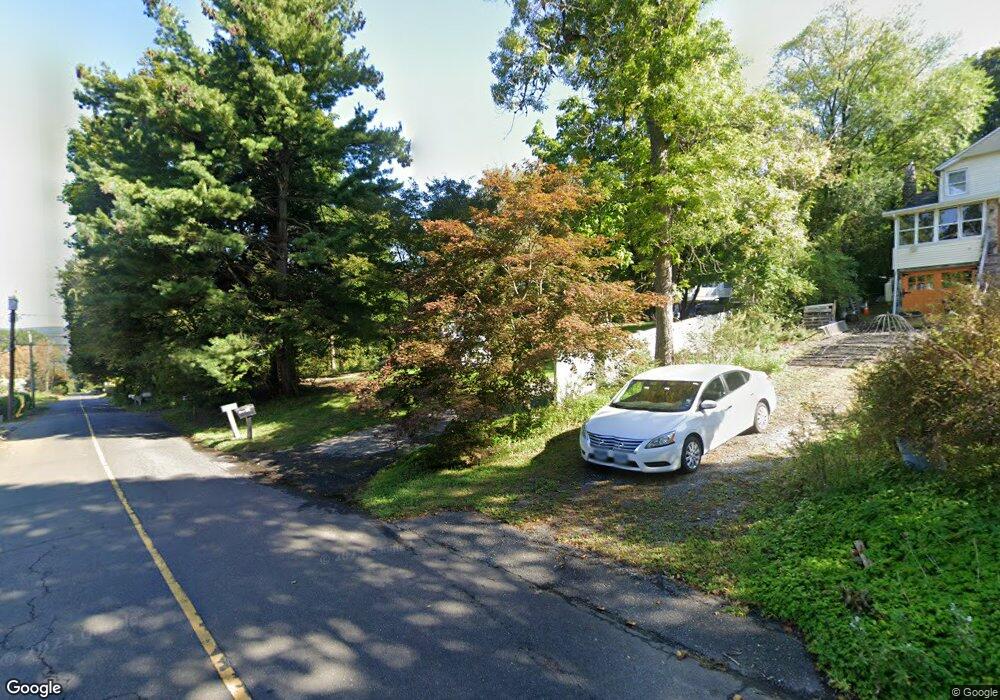
20 Fulton Dr New Fairfield, CT 06812
Estimated Value: $328,000 - $418,000
3
Beds
2
Baths
1,570
Sq Ft
$244/Sq Ft
Est. Value
About This Home
This home is located at 20 Fulton Dr, New Fairfield, CT 06812 and is currently estimated at $383,185, approximately $244 per square foot. 20 Fulton Dr is a home located in Fairfield County with nearby schools including Meeting House Hill School, New Fairfield Middle School, and New Fairfield High School.
Ownership History
Date
Name
Owned For
Owner Type
Purchase Details
Closed on
Jun 25, 2025
Sold by
Alesi Joseph W and Ives Bank
Bought by
Centeno Jenny P
Current Estimated Value
Purchase Details
Closed on
Jun 9, 2000
Sold by
Murphy Margaret
Bought by
Alesi Joe and Alesi Rhonda
Purchase Details
Closed on
May 15, 1992
Sold by
Gebhardt Jack and Gebhardt Joan
Bought by
Murphy Margaret
Create a Home Valuation Report for This Property
The Home Valuation Report is an in-depth analysis detailing your home's value as well as a comparison with similar homes in the area
Home Values in the Area
Average Home Value in this Area
Purchase History
| Date | Buyer | Sale Price | Title Company |
|---|---|---|---|
| Centeno Jenny P | $166,300 | -- | |
| Centeno Jenny P | $166,300 | -- | |
| Alesi Joe | $153,000 | -- | |
| Alesi Joe | $153,000 | -- | |
| Murphy Margaret | $105,000 | -- |
Source: Public Records
Mortgage History
| Date | Status | Borrower | Loan Amount |
|---|---|---|---|
| Previous Owner | Murphy Margaret | $213,122 | |
| Previous Owner | Murphy Margaret | $242,000 | |
| Previous Owner | Murphy Margaret | $60,000 |
Source: Public Records
Tax History Compared to Growth
Tax History
| Year | Tax Paid | Tax Assessment Tax Assessment Total Assessment is a certain percentage of the fair market value that is determined by local assessors to be the total taxable value of land and additions on the property. | Land | Improvement |
|---|---|---|---|---|
| 2025 | $6,317 | $239,900 | $89,800 | $150,100 |
| 2024 | $6,121 | $167,600 | $83,700 | $83,900 |
| 2023 | $5,849 | $167,600 | $83,700 | $83,900 |
| 2022 | $5,442 | $167,600 | $83,700 | $83,900 |
| 2021 | $5,278 | $167,600 | $83,700 | $83,900 |
| 2020 | $5,125 | $167,600 | $83,700 | $83,900 |
| 2019 | $4,400 | $142,400 | $68,300 | $74,100 |
| 2018 | $4,355 | $142,400 | $68,300 | $74,100 |
| 2017 | $4,246 | $142,400 | $68,300 | $74,100 |
| 2016 | $4,084 | $142,400 | $68,300 | $74,100 |
| 2015 | $4,084 | $142,400 | $68,300 | $74,100 |
| 2014 | $4,126 | $158,200 | $76,200 | $82,000 |
Source: Public Records
Map
Nearby Homes