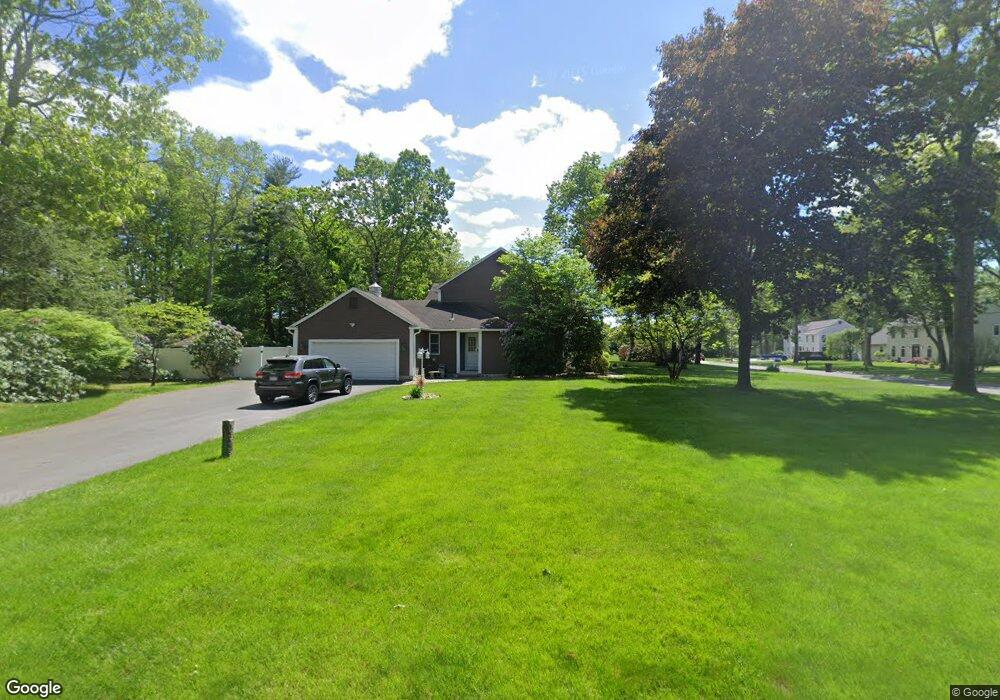
20 Gary Dr Westfield, MA 01085
Estimated Value: $573,000 - $658,000
4
Beds
3
Baths
2,913
Sq Ft
$212/Sq Ft
Est. Value
About This Home
This home is located at 20 Gary Dr, Westfield, MA 01085 and is currently estimated at $616,929, approximately $211 per square foot. 20 Gary Dr is a home located in Hampden County with nearby schools including Westfield High School and Saint Mary High School.
Ownership History
Date
Name
Owned For
Owner Type
Purchase Details
Closed on
Feb 27, 2023
Sold by
Sullivan Donna M and Sullivan Thomas P
Bought by
D M Sullivan Indenture Re
Current Estimated Value
Purchase Details
Closed on
Mar 30, 1990
Sold by
Paquette Charles A
Bought by
Sullivan Donna M
Home Financials for this Owner
Home Financials are based on the most recent Mortgage that was taken out on this home.
Original Mortgage
$75,000
Interest Rate
9.96%
Mortgage Type
Purchase Money Mortgage
Create a Home Valuation Report for This Property
The Home Valuation Report is an in-depth analysis detailing your home's value as well as a comparison with similar homes in the area
Home Values in the Area
Average Home Value in this Area
Purchase History
| Date | Buyer | Sale Price | Title Company |
|---|---|---|---|
| D M Sullivan Indenture Re | -- | None Available | |
| Sullivan Donna M | $320,000 | -- |
Source: Public Records
Mortgage History
| Date | Status | Borrower | Loan Amount |
|---|---|---|---|
| Previous Owner | Sullivan Donna M | $75,000 |
Source: Public Records
Tax History Compared to Growth
Tax History
| Year | Tax Paid | Tax Assessment Tax Assessment Total Assessment is a certain percentage of the fair market value that is determined by local assessors to be the total taxable value of land and additions on the property. | Land | Improvement |
|---|---|---|---|---|
| 2025 | $7,919 | $521,700 | $162,200 | $359,500 |
| 2024 | $7,951 | $497,900 | $148,000 | $349,900 |
| 2023 | $7,824 | $460,800 | $140,500 | $320,300 |
| 2022 | $7,549 | $408,300 | $125,300 | $283,000 |
| 2021 | $7,327 | $388,100 | $118,500 | $269,600 |
| 2020 | $7,267 | $377,500 | $118,500 | $259,000 |
| 2019 | $7,105 | $361,200 | $112,600 | $248,600 |
| 2018 | $6,993 | $361,200 | $112,600 | $248,600 |
| 2017 | $6,840 | $352,200 | $114,100 | $238,100 |
| 2016 | $6,847 | $352,200 | $114,100 | $238,100 |
| 2015 | $6,374 | $343,800 | $114,100 | $229,700 |
| 2014 | $4,772 | $343,800 | $114,100 | $229,700 |
Source: Public Records
Map
Nearby Homes
- 94 Pineridge Dr
- 20 Raymond Cir
- 16 Locust St
- 60 Shaker Rd
- 360 Falley Dr
- 57 Falley Dr
- 451 Falley Dr
- 0 Little River Road ( Rear )
- 1037 Shaker Rd
- 929 Shaker Rd Unit 18
- 138 Main St Unit 13
- 138 Main St Unit 11
- 103 Feeding Hills Rd
- 0 Feeding Hills Rd
- 33 George St
- 23 Hancock St
- 16 Yale St
- 0 E Mountain Rd
- 13 William St
- 70-74 S Maple St