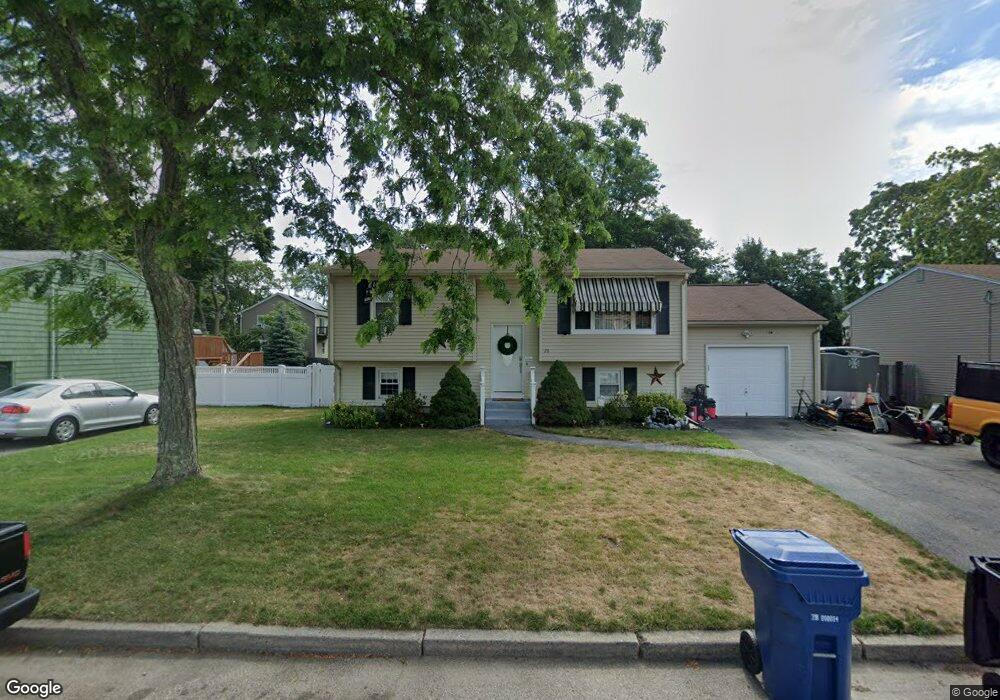
20 Gateway Ct Warwick, RI 02889
Hoxie NeighborhoodEstimated Value: $382,894 - $455,000
3
Beds
1
Bath
1,280
Sq Ft
$323/Sq Ft
Est. Value
About This Home
This home is located at 20 Gateway Ct, Warwick, RI 02889 and is currently estimated at $413,974, approximately $323 per square foot. 20 Gateway Ct is a home located in Kent County with nearby schools including Saint Kevin School and Bishop Hendricken High School.
Ownership History
Date
Name
Owned For
Owner Type
Purchase Details
Closed on
Sep 6, 2018
Sold by
Silva Michael
Bought by
Gelinas John D
Current Estimated Value
Purchase Details
Closed on
May 29, 1998
Sold by
Catuogno Marie
Bought by
Silva Michael J
Create a Home Valuation Report for This Property
The Home Valuation Report is an in-depth analysis detailing your home's value as well as a comparison with similar homes in the area
Home Values in the Area
Average Home Value in this Area
Purchase History
| Date | Buyer | Sale Price | Title Company |
|---|---|---|---|
| Gelinas John D | -- | -- | |
| Silva Michael J | $91,000 | -- |
Source: Public Records
Mortgage History
| Date | Status | Borrower | Loan Amount |
|---|---|---|---|
| Previous Owner | Silva Michael J | $182,000 | |
| Previous Owner | Silva Michael J | $32,000 | |
| Previous Owner | Silva Michael J | $135,000 | |
| Previous Owner | Silva Michael J | $13,500 |
Source: Public Records
Tax History
| Year | Tax Paid | Tax Assessment Tax Assessment Total Assessment is a certain percentage of the fair market value that is determined by local assessors to be the total taxable value of land and additions on the property. | Land | Improvement |
|---|---|---|---|---|
| 2025 | $4,514 | $355,400 | $108,400 | $247,000 |
| 2024 | $4,368 | $301,900 | $94,300 | $207,600 |
| 2023 | $4,284 | $301,900 | $94,300 | $207,600 |
| 2022 | $4,224 | $225,500 | $67,300 | $158,200 |
| 2021 | $4,224 | $225,500 | $67,300 | $158,200 |
| 2020 | $4,224 | $225,500 | $67,300 | $158,200 |
| 2019 | $4,224 | $225,500 | $67,300 | $158,200 |
| 2018 | $3,773 | $181,400 | $67,300 | $114,100 |
| 2017 | $3,672 | $181,400 | $67,300 | $114,100 |
| 2016 | $3,672 | $181,400 | $67,300 | $114,100 |
| 2015 | $3,395 | $163,600 | $60,200 | $103,400 |
| 2014 | $3,282 | $163,600 | $60,200 | $103,400 |
| 2013 | $3,238 | $163,600 | $60,200 | $103,400 |
Source: Public Records
Map
Nearby Homes
Your Personal Tour Guide
Ask me questions while you tour the home.