Estimated Value: $180,329 - $251,000
--
Bed
--
Bath
1,488
Sq Ft
$152/Sq Ft
Est. Value
About This Home
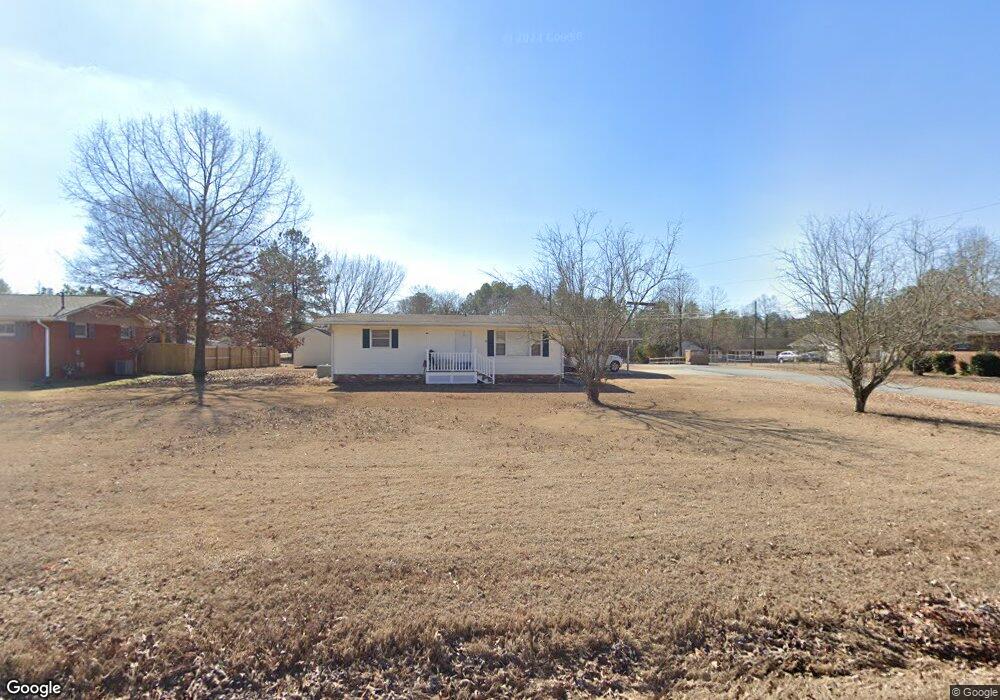
This home is located at 20 Glen View Dr NE, Rome, GA 30165 and is currently estimated at $225,582, approximately $151 per square foot. 20 Glen View Dr NE is a home located in Floyd County with nearby schools including Armuchee Middle School, Armuchee High School, and Unity Christian School.
Ownership History
Date
Name
Owned For
Owner Type
Purchase Details
Closed on
Jul 13, 2022
Sold by
Gilbreath Gene Walton
Bought by
Gilbreath Jane Elizabeth
Current Estimated Value
Purchase Details
Closed on
Nov 5, 1982
Sold by
Nichols Thomas Jackson
Bought by
Gilbreath Gene W
Purchase Details
Closed on
Nov 29, 1977
Sold by
Wheeler Charlotte Nan
Bought by
Nichols Thomas Jackson
Purchase Details
Closed on
Dec 8, 1976
Sold by
Mackby Danny L and Mackby Janet
Bought by
Wheeler Charlotte Nan
Purchase Details
Closed on
Feb 17, 1971
Sold by
Satterfield Erika Mrs
Bought by
Mackby Danny L and Mackby Janet
Purchase Details
Closed on
Mar 28, 1967
Sold by
Johnson R L
Bought by
Satterfield Erika Mrs
Purchase Details
Closed on
Mar 24, 1967
Sold by
Edwards Stephens H
Bought by
Johnson R L
Purchase Details
Closed on
Sep 7, 1965
Sold by
Johnson R L
Bought by
Edwards Stephens H
Purchase Details
Closed on
Sep 29, 1962
Sold by
Johnson Robert N
Bought by
Johnson R L
Purchase Details
Closed on
Jan 1, 1961
Bought by
Johnson Robert N
Create a Home Valuation Report for This Property
The Home Valuation Report is an in-depth analysis detailing your home's value as well as a comparison with similar homes in the area
Home Values in the Area
Average Home Value in this Area
Purchase History
| Date | Buyer | Sale Price | Title Company |
|---|---|---|---|
| Gilbreath Jane Elizabeth | -- | -- | |
| Gilbreath Gene W | $28,600 | -- | |
| Nichols Thomas Jackson | $26,200 | -- | |
| Wheeler Charlotte Nan | $21,500 | -- | |
| Mackby Danny L | $12,200 | -- | |
| Satterfield Erika Mrs | -- | -- | |
| Johnson R L | -- | -- | |
| Edwards Stephens H | $10,000 | -- | |
| Johnson R L | -- | -- | |
| Johnson Robert N | -- | -- |
Source: Public Records
Tax History Compared to Growth
Tax History
| Year | Tax Paid | Tax Assessment Tax Assessment Total Assessment is a certain percentage of the fair market value that is determined by local assessors to be the total taxable value of land and additions on the property. | Land | Improvement |
|---|---|---|---|---|
| 2024 | $1,890 | $62,947 | $6,868 | $56,079 |
| 2023 | $1,801 | $59,969 | $6,060 | $53,909 |
| 2022 | $1,399 | $47,159 | $4,848 | $42,311 |
| 2021 | $1,181 | $39,116 | $4,848 | $34,268 |
| 2020 | $1,061 | $34,861 | $3,636 | $31,225 |
| 2019 | $995 | $33,111 | $3,636 | $29,475 |
| 2018 | $777 | $25,816 | $3,636 | $22,180 |
| 2017 | $753 | $24,976 | $3,636 | $21,340 |
| 2016 | $734 | $24,069 | $3,600 | $20,469 |
| 2015 | $718 | $24,069 | $3,600 | $20,469 |
| 2014 | $718 | $24,069 | $3,600 | $20,469 |
Source: Public Records
Map
Nearby Homes
- The Pearson Plan at Southbend
- The Harrington Plan at Southbend
- The Landen Plan at Southbend
- The Benson II Plan at Southbend
- The Caldwell Plan at Southbend
- The Bradley Plan at Southbend
- The McGinnis Plan at Southbend
- The Crawford Plan at Southbend
- 4 Sleepy Oaks Trail NE
- 107 Selman Rd NW
- 109 Royal Oak Dr NE
- 100 Royal Oak Dr NE
- 637 Old Summerville Rd NW
- 631 Old Summerville Rd NW
- 665 Old Summerville Rd NW
- 3158 Martha Berry Hwy
- 756 Old Summerville Rd NW
- 10 Oak View Dr NE
- 3 Coggins Place NE
- 3 Coggins Place NE
- 18 Glen View Dr NE
- 24 Glen View Dr NE
- 21 Glen View Dr NE
- 19 Glen View Dr NE
- 23 Glen View Dr NE
- 26 Glen View Dr NE
- 14 Glen View Dr NE
- 17 Glen View Dr NE
- 25 Glen View Dr NE
- 0 Gilbreath Property Unit 3564554-5775130
- 28 Glen View Dr NE
- 15 Glen View Dr NE
- 27 Glen View Dr NE
- 12 Glen View Dr NE
- 5 Sapling Ct NE
- 30 Glen View Dr NE
- 4 Sapling Ct NE
- 68 Gene Dr NE
- 29 Glen View Dr NE
- 18 Honeytree Trail NE