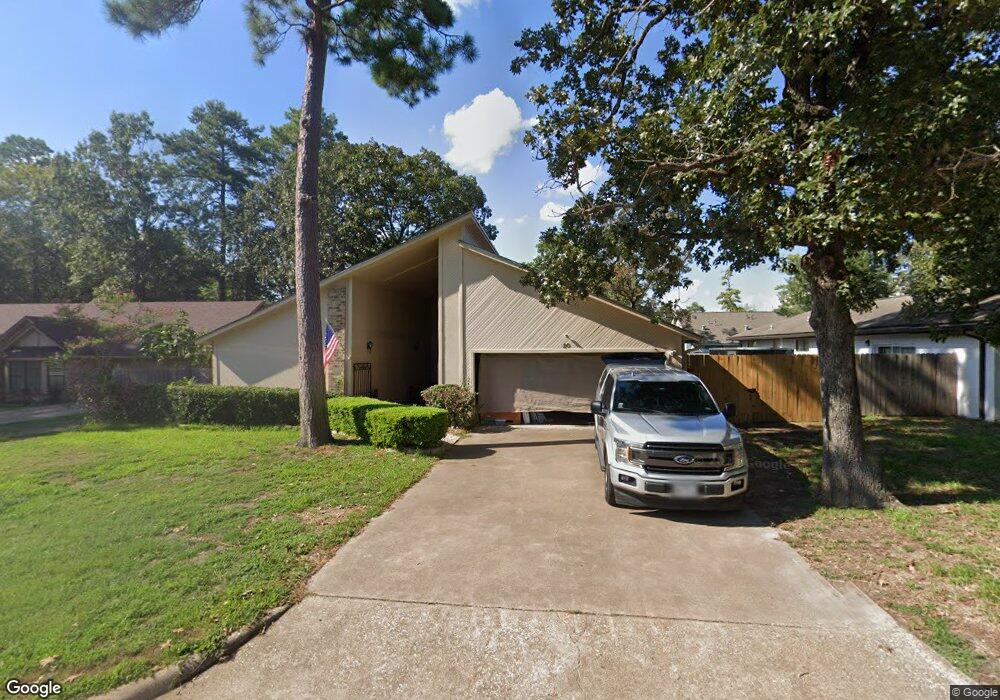
20 Glenview Ct Lufkin, TX 75901
Estimated Value: $225,029 - $267,000
3
Beds
2
Baths
1,878
Sq Ft
$135/Sq Ft
Est. Value
About This Home
This home is located at 20 Glenview Ct, Lufkin, TX 75901 and is currently estimated at $253,257, approximately $134 per square foot. 20 Glenview Ct is a home located in Angelina County with nearby schools including Kurth Primary School, Anderson Elementary School, and Lufkin Middle School.
Ownership History
Date
Name
Owned For
Owner Type
Purchase Details
Closed on
Oct 11, 2013
Sold by
Friesen John P and Friesen Lindsey B
Bought by
George Henderson Jr Family Trust
Current Estimated Value
Purchase Details
Closed on
Aug 9, 2010
Sold by
Lemon Maria J
Bought by
Lemon Carl D and Lemon Maria J
Purchase Details
Closed on
Jun 14, 2010
Sold by
Marney Raymond L
Bought by
Love Mark L
Purchase Details
Closed on
Jan 16, 2006
Sold by
Vcd-Jcd Family Partnership Ltd
Bought by
Kingham James A
Create a Home Valuation Report for This Property
The Home Valuation Report is an in-depth analysis detailing your home's value as well as a comparison with similar homes in the area
Home Values in the Area
Average Home Value in this Area
Purchase History
| Date | Buyer | Sale Price | Title Company |
|---|---|---|---|
| George Henderson Jr Family Trust | -- | None Available | |
| Lemon Carl D | -- | None Available | |
| Love Mark L | -- | Community Title | |
| Kingham James A | -- | None Available |
Source: Public Records
Tax History Compared to Growth
Tax History
| Year | Tax Paid | Tax Assessment Tax Assessment Total Assessment is a certain percentage of the fair market value that is determined by local assessors to be the total taxable value of land and additions on the property. | Land | Improvement |
|---|---|---|---|---|
| 2025 | $4,688 | $224,350 | $16,830 | $207,520 |
| 2024 | $4,582 | $219,350 | $16,830 | $202,520 |
| 2023 | $3,961 | $216,040 | $16,830 | $199,210 |
| 2022 | $2,590 | $195,030 | $16,830 | $178,200 |
| 2021 | $4,058 | $178,230 | $16,830 | $161,400 |
| 2020 | $3,681 | $149,770 | $16,830 | $132,940 |
| 2019 | $3,894 | $149,800 | $16,830 | $132,970 |
| 2018 | $3,036 | $145,650 | $16,830 | $128,820 |
| 2017 | $3,036 | $140,080 | $16,830 | $123,250 |
| 2016 | $3,225 | $135,270 | $16,830 | $118,440 |
| 2015 | $3,077 | $135,270 | $16,830 | $118,440 |
| 2014 | $3,077 | $132,970 | $16,830 | $116,140 |
Source: Public Records
Map
Nearby Homes