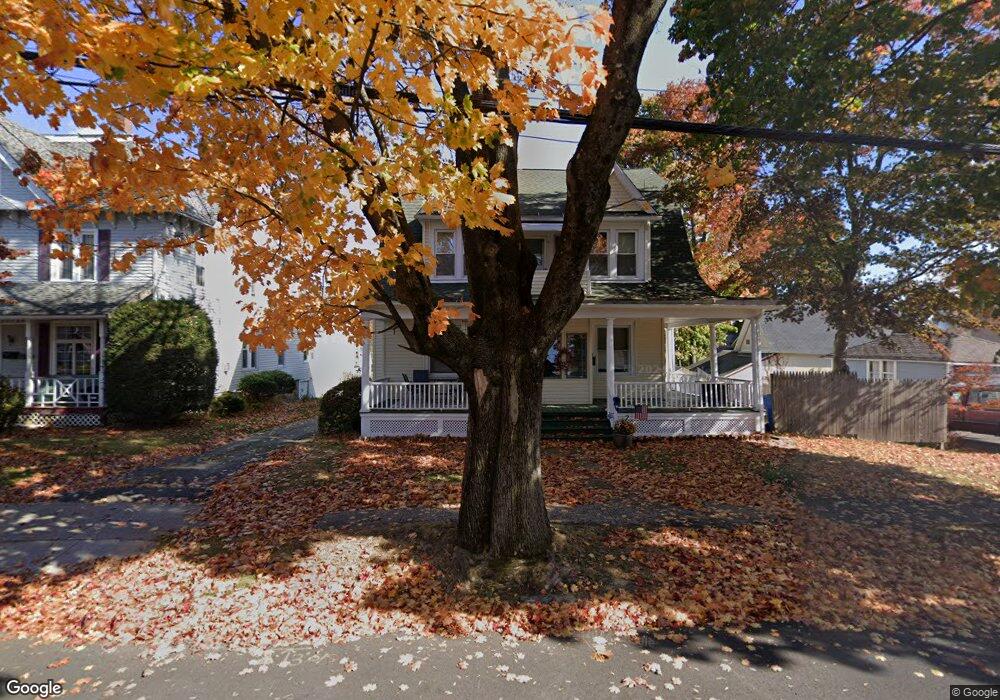
20 Goodwin St Bristol, CT 06010
Federal Hill NeighborhoodEstimated Value: $361,000 - $384,010
5
Beds
3
Baths
2,307
Sq Ft
$161/Sq Ft
Est. Value
About This Home
This home is located at 20 Goodwin St, Bristol, CT 06010 and is currently estimated at $371,003, approximately $160 per square foot. 20 Goodwin St is a home located in Hartford County with nearby schools including Ellen P. Hubbell School, Chippens Hill Middle School, and Bristol Eastern High School.
Ownership History
Date
Name
Owned For
Owner Type
Purchase Details
Closed on
Jun 1, 2022
Sold by
Gleason Carol D
Bought by
Gleason Carol D and Gleason David F
Current Estimated Value
Purchase Details
Closed on
Oct 29, 2012
Sold by
Gleason David F
Bought by
Gleason Carol D
Purchase Details
Closed on
Jan 10, 1990
Sold by
Dobbins George
Bought by
Gleason David F
Create a Home Valuation Report for This Property
The Home Valuation Report is an in-depth analysis detailing your home's value as well as a comparison with similar homes in the area
Home Values in the Area
Average Home Value in this Area
Purchase History
| Date | Buyer | Sale Price | Title Company |
|---|---|---|---|
| Gleason Carol D | -- | None Available | |
| Gleason Carol D | -- | -- | |
| Gleason David F | $125,000 | -- |
Source: Public Records
Mortgage History
| Date | Status | Borrower | Loan Amount |
|---|---|---|---|
| Previous Owner | Gleason David F | $141,000 | |
| Previous Owner | Gleason David F | $143,800 |
Source: Public Records
Tax History
| Year | Tax Paid | Tax Assessment Tax Assessment Total Assessment is a certain percentage of the fair market value that is determined by local assessors to be the total taxable value of land and additions on the property. | Land | Improvement |
|---|---|---|---|---|
| 2025 | $6,717 | $199,010 | $36,050 | $162,960 |
| 2024 | $6,338 | $199,010 | $36,050 | $162,960 |
| 2023 | $6,040 | $199,010 | $36,050 | $162,960 |
| 2022 | $5,680 | $148,120 | $27,300 | $120,820 |
| 2021 | $5,680 | $148,120 | $27,300 | $120,820 |
| 2020 | $5,680 | $148,120 | $27,300 | $120,820 |
| 2019 | $5,636 | $148,120 | $27,300 | $120,820 |
| 2018 | $5,463 | $148,120 | $27,300 | $120,820 |
| 2017 | $5,443 | $151,060 | $38,990 | $112,070 |
| 2016 | $5,443 | $151,060 | $38,990 | $112,070 |
| 2015 | $5,228 | $151,060 | $38,990 | $112,070 |
| 2014 | $5,228 | $151,060 | $38,990 | $112,070 |
Source: Public Records
Map
Nearby Homes
Your Personal Tour Guide
Ask me questions while you tour the home.