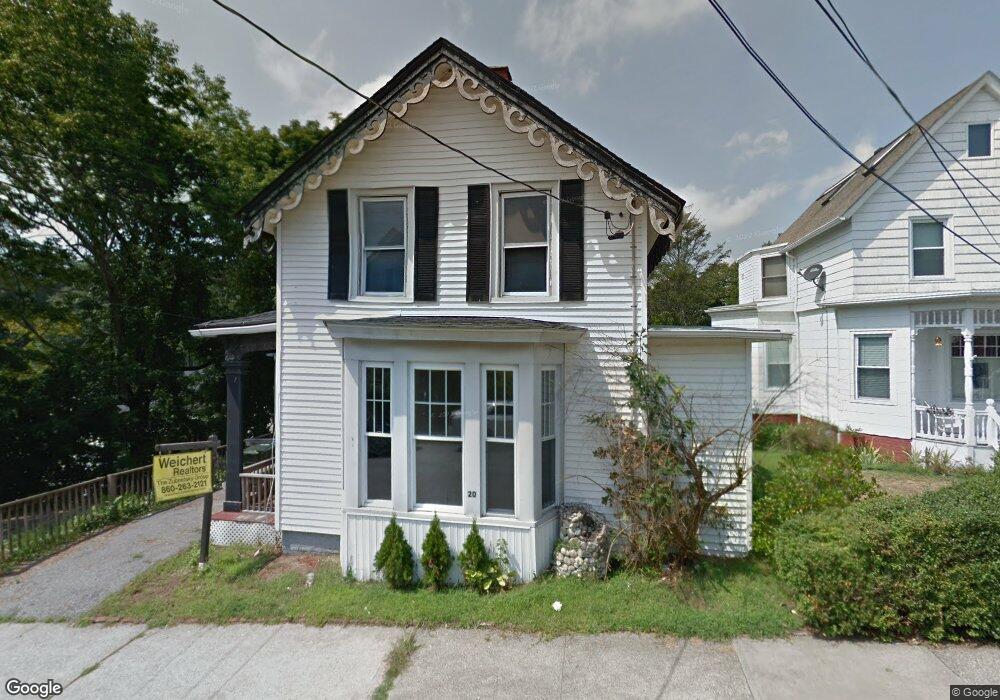
20 Grove St Unit 1 Norwich, CT 06360
Central Norwich NeighborhoodEstimated Value: $287,000 - $337,000
4
Beds
3
Baths
2,613
Sq Ft
$120/Sq Ft
Est. Value
About This Home
This home is located at 20 Grove St Unit 1, Norwich, CT 06360 and is currently estimated at $313,666, approximately $120 per square foot. 20 Grove St Unit 1 is a home located in New London County with nearby schools including Moriarty Magnet Elementary School, Kelly STEAM Magnet Middle School, and Integrated Day Charter School.
Ownership History
Date
Name
Owned For
Owner Type
Purchase Details
Closed on
Dec 21, 2017
Sold by
Castlerrock 2017 Llc
Bought by
Vinberg Teresa M
Current Estimated Value
Purchase Details
Closed on
Dec 14, 2017
Sold by
Hsbc Bank Usa Na Tr
Bought by
Castlerock 2017 Llc
Purchase Details
Closed on
Feb 11, 2016
Sold by
Chiarella Thomas
Bought by
Hsbc Bank Usa Na Tr
Purchase Details
Closed on
Mar 15, 2006
Sold by
Snyder David
Bought by
Kac Rentals Llc
Purchase Details
Closed on
Jan 29, 2001
Sold by
Ri Waterman Prop
Bought by
Sayder David C
Create a Home Valuation Report for This Property
The Home Valuation Report is an in-depth analysis detailing your home's value as well as a comparison with similar homes in the area
Home Values in the Area
Average Home Value in this Area
Purchase History
| Date | Buyer | Sale Price | Title Company |
|---|---|---|---|
| Vinberg Teresa M | $44,900 | -- | |
| Vinberg Teresa M | $44,900 | -- | |
| Castlerock 2017 Llc | $26,100 | -- | |
| Castlerock 2017 Llc | $26,100 | -- | |
| Hsbc Bank Usa Na Tr | -- | -- | |
| Hsbc Bank Usa Na Tr | -- | -- | |
| Kac Rentals Llc | $99,000 | -- | |
| Sayder David C | $39,000 | -- | |
| Vinberg Teresa M | $44,900 | -- | |
| Castlerock 2017 Llc | $26,100 | -- | |
| Hsbc Bank Usa Na Tr | -- | -- | |
| Kac Rentals Llc | $99,000 | -- | |
| Sayder David C | $39,000 | -- |
Source: Public Records
Mortgage History
| Date | Status | Borrower | Loan Amount |
|---|---|---|---|
| Previous Owner | Sayder David C | $70,000 | |
| Previous Owner | Sayder David C | $45,000 |
Source: Public Records
Tax History Compared to Growth
Tax History
| Year | Tax Paid | Tax Assessment Tax Assessment Total Assessment is a certain percentage of the fair market value that is determined by local assessors to be the total taxable value of land and additions on the property. | Land | Improvement |
|---|---|---|---|---|
| 2025 | $7,192 | $177,700 | $27,800 | $149,900 |
| 2024 | $6,788 | $177,700 | $27,800 | $149,900 |
| 2023 | $5,725 | $117,700 | $19,700 | $98,000 |
| 2022 | $5,706 | $117,700 | $19,700 | $98,000 |
| 2021 | $5,725 | $117,700 | $19,700 | $98,000 |
| 2020 | $5,705 | $117,700 | $19,700 | $98,000 |
| 2019 | $5,648 | $117,700 | $19,700 | $98,000 |
| 2018 | $4,902 | $101,300 | $23,200 | $78,100 |
| 2017 | $4,937 | $101,300 | $23,200 | $78,100 |
| 2016 | $4,970 | $101,300 | $23,200 | $78,100 |
| 2015 | $4,868 | $101,300 | $23,200 | $78,100 |
| 2014 | $4,653 | $101,300 | $23,200 | $78,100 |
Source: Public Records
Map
Nearby Homes
- 20 Grove St
- 1 Mckinley Ct
- 22 Grove St
- 22 Grove St Unit 2
- 11 Mckinley Ave
- 7 Mckinley Ave
- 15 Mckinley Ave
- 11 Grove St
- 23 Grove St
- 19 Mckinley Ave
- 19 Mckinley Ave Unit 2
- 19 Mckinley Ave Unit 1
- 8 Grove St
- 30 Grove St
- 17 Grove St
- 17 Grove St Unit 17A
- 23 Grove St
- 2 Mckinley Ct
- 57 Freeman Ave
- 57 Freeman Ave Unit c