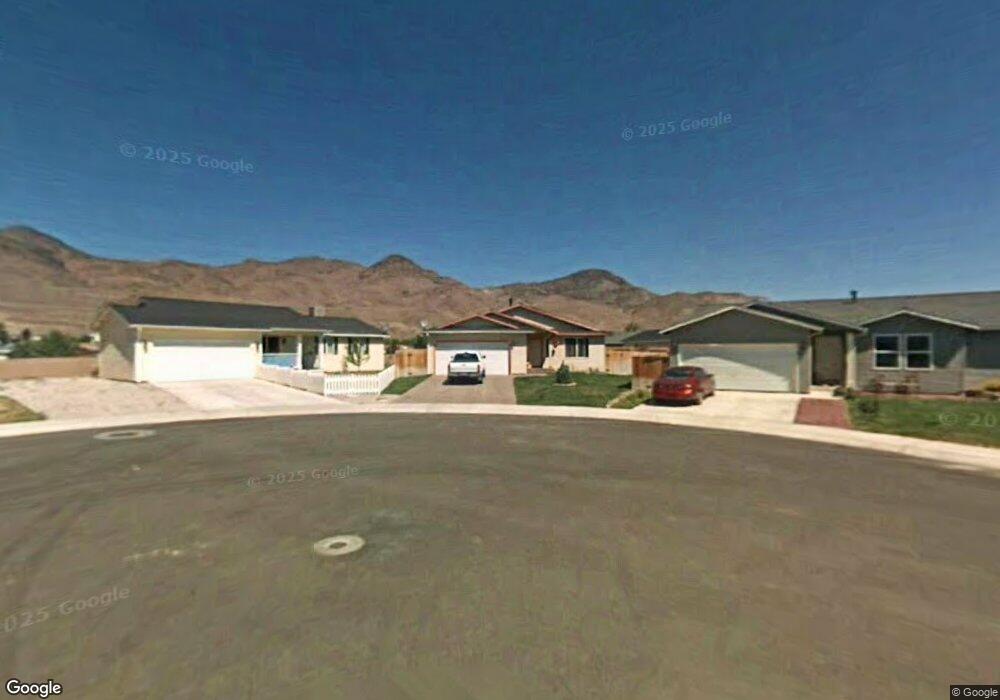
20 Gulch Ct Dayton, NV 89403
Estimated Value: $371,163 - $452,000
3
Beds
2
Baths
1,244
Sq Ft
$316/Sq Ft
Est. Value
About This Home
This home is located at 20 Gulch Ct, Dayton, NV 89403 and is currently estimated at $393,291, approximately $316 per square foot. 20 Gulch Ct is a home located in Lyon County with nearby schools including Sutro Elementary School, Dayton Intermediate School, and Dayton High School.
Ownership History
Date
Name
Owned For
Owner Type
Purchase Details
Closed on
Sep 14, 2020
Sold by
Barrera Luis F
Bought by
Alegria Veronica C
Current Estimated Value
Purchase Details
Closed on
Aug 3, 2018
Sold by
Alegria Veronica
Bought by
Alegria Veronica C and Barrer Luis F
Home Financials for this Owner
Home Financials are based on the most recent Mortgage that was taken out on this home.
Original Mortgage
$182,831
Interest Rate
4.5%
Purchase Details
Closed on
Nov 30, 2006
Sold by
Citizens For Affordable Homes Inc
Bought by
Alegria Veronica
Home Financials for this Owner
Home Financials are based on the most recent Mortgage that was taken out on this home.
Original Mortgage
$114,658
Interest Rate
6.38%
Create a Home Valuation Report for This Property
The Home Valuation Report is an in-depth analysis detailing your home's value as well as a comparison with similar homes in the area
Home Values in the Area
Average Home Value in this Area
Purchase History
| Date | Buyer | Sale Price | Title Company |
|---|---|---|---|
| Alegria Veronica C | -- | Ticor Title Reno | |
| Alegria Veronica C | -- | Ticor Title Cc | |
| Alegria Veronica C | -- | Ticor Title Of Nevada Inc | |
| Alegria Veronica | -- | Western Title Company Inc | |
| Alegria Veronica | $56,500 | Western Title Company Inc |
Source: Public Records
Mortgage History
| Date | Status | Borrower | Loan Amount |
|---|---|---|---|
| Previous Owner | Alegria Veronica C | $182,831 | |
| Previous Owner | Alegria Veronica C | $208,000 | |
| Previous Owner | Alegria Veronica | $114,658 |
Source: Public Records
Tax History Compared to Growth
Tax History
| Year | Tax Paid | Tax Assessment Tax Assessment Total Assessment is a certain percentage of the fair market value that is determined by local assessors to be the total taxable value of land and additions on the property. | Land | Improvement |
|---|---|---|---|---|
| 2025 | $1,300 | $81,730 | $33,950 | $47,780 |
| 2024 | $1,262 | $78,759 | $30,800 | $47,959 |
| 2023 | $1,262 | $73,721 | $28,700 | $45,021 |
| 2022 | $1,026 | $80,725 | $39,012 | $41,713 |
| 2021 | $996 | $79,588 | $39,012 | $40,576 |
| 2020 | $966 | $77,538 | $39,010 | $38,528 |
| 2019 | $938 | $76,184 | $39,010 | $37,174 |
| 2018 | $911 | $57,222 | $21,000 | $36,222 |
| 2017 | $884 | $46,660 | $10,500 | $36,160 |
| 2016 | $862 | $34,309 | $5,250 | $29,059 |
| 2015 | $860 | $28,821 | $5,250 | $23,571 |
| 2014 | $835 | $26,139 | $6,300 | $19,839 |
Source: Public Records
Map
Nearby Homes
- 221 Glen Vista Dr
- 240 Misty Way
- 214 Green Ln
- 188 Rose Peak Rd
- 475 Sheep Camp Dr Unit Lot 141
- 471 Sheep Camp Dr Unit Lot 139
- 469 Sheep Camp Dr Unit Amber 138
- 469 Sheep Camp Dr
- 467 Sheep Camp Dr Unit Lot 137
- 467 Sheep Camp Dr
- 463 Sheep Camp Dr
- 462 Sheep Camp Dr
- 474 Sheep Camp Dr
- 470 Sheep Camp Dr
- 470 Sheep Camp Dr Unit Lot 129
- 468 Sheep Camp Dr
- 466 Sheep Camp Dr
- 6 Grosh Ave
- 502 Russell Rd Unit Lot 93
- 500 Russell Rd Unit Lot 92