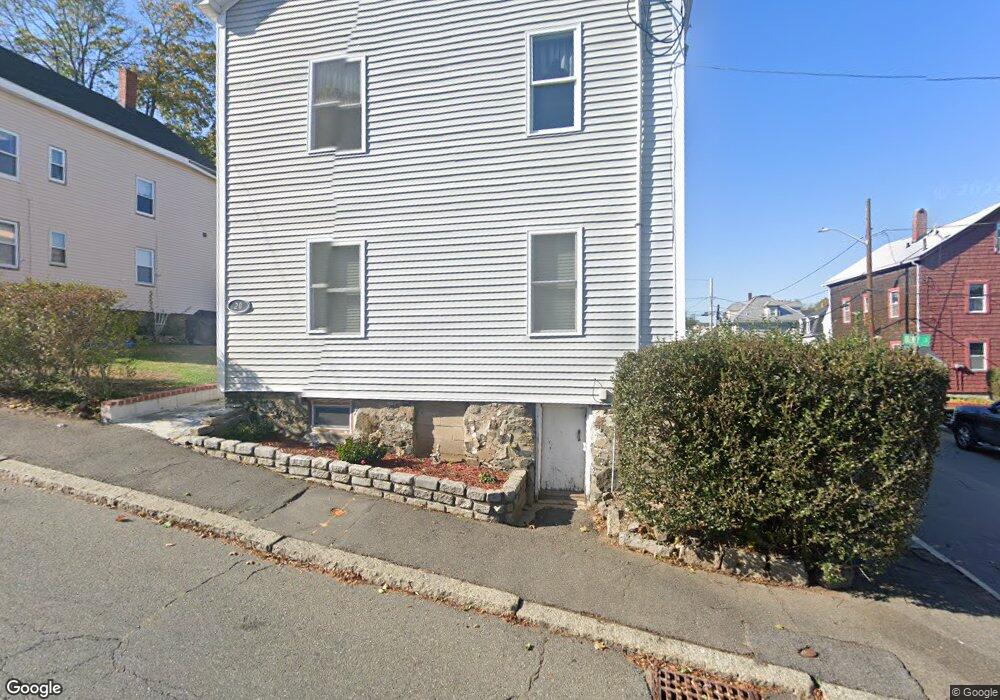
20 Hanson St Salem, MA 01970
Gallows Hill NeighborhoodEstimated Value: $744,000 - $795,000
4
Beds
3
Baths
2,097
Sq Ft
$361/Sq Ft
Est. Value
About This Home
This home is located at 20 Hanson St, Salem, MA 01970 and is currently estimated at $757,646, approximately $361 per square foot. 20 Hanson St is a home located in Essex County with nearby schools including Witchcraft Heights Elementary School, Horace Mann Laboratory, and Saltonstall School.
Ownership History
Date
Name
Owned For
Owner Type
Purchase Details
Closed on
May 2, 2020
Sold by
Simpson Edward F
Bought by
Simpson Edward F and Simpson Tyler
Current Estimated Value
Purchase Details
Closed on
Jan 1, 1976
Bought by
Simpson Edward F and Simpson Jacqueline A
Create a Home Valuation Report for This Property
The Home Valuation Report is an in-depth analysis detailing your home's value as well as a comparison with similar homes in the area
Home Values in the Area
Average Home Value in this Area
Purchase History
| Date | Buyer | Sale Price | Title Company |
|---|---|---|---|
| Simpson Edward F | -- | None Available | |
| Simpson Edward F | $26,500 | -- |
Source: Public Records
Mortgage History
| Date | Status | Borrower | Loan Amount |
|---|---|---|---|
| Previous Owner | Simpson Edward F | $139,000 | |
| Previous Owner | Simpson Edward F | $50,000 | |
| Previous Owner | Simpson Edward F | $100,000 | |
| Previous Owner | Simpson Edward F | $100,000 |
Source: Public Records
Tax History
| Year | Tax Paid | Tax Assessment Tax Assessment Total Assessment is a certain percentage of the fair market value that is determined by local assessors to be the total taxable value of land and additions on the property. | Land | Improvement |
|---|---|---|---|---|
| 2025 | $7,476 | $659,300 | $196,500 | $462,800 |
| 2024 | $7,180 | $617,900 | $186,700 | $431,200 |
| 2023 | $7,001 | $559,600 | $172,400 | $387,200 |
| 2022 | $5,993 | $452,300 | $166,600 | $285,700 |
| 2021 | $5,996 | $434,500 | $155,100 | $279,400 |
| 2020 | $5,884 | $407,200 | $146,500 | $260,700 |
| 2019 | $5,824 | $385,700 | $139,000 | $246,700 |
| 2018 | $5,395 | $350,800 | $132,100 | $218,700 |
| 2017 | $5,017 | $316,300 | $111,500 | $204,800 |
| 2016 | $4,875 | $311,100 | $106,300 | $204,800 |
| 2015 | $4,724 | $287,900 | $97,700 | $190,200 |
Source: Public Records
Map
Nearby Homes
- 12 Varney St
- 23 Proctor St
- 128 Boston St Unit 4
- 15 Wall St
- 107 Mason St
- 111 Mason St
- 145 Boston St
- 55 Summit St
- 68 Beaver St
- 82 Flint St
- 86 Flint St
- 35 Flint St Unit 209
- 35 Flint St Unit 106
- 18 Dalton Pkwy Unit 18
- 145 Federal St Unit 3
- 20 Beacon St
- 4 Valley St
- 23 River St
- 16 River St
- 15 Phelps St Unit 1
Your Personal Tour Guide
Ask me questions while you tour the home.