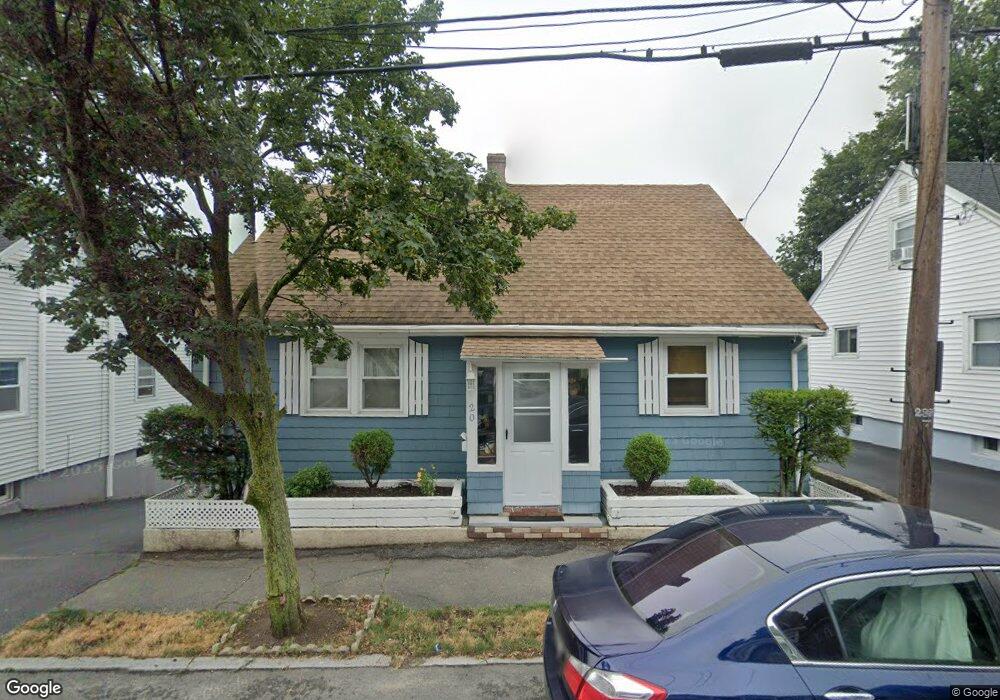
20 Hazel St Salem, MA 01970
South Salem NeighborhoodEstimated Value: $571,000 - $671,000
4
Beds
2
Baths
1,456
Sq Ft
$423/Sq Ft
Est. Value
About This Home
This home is located at 20 Hazel St, Salem, MA 01970 and is currently estimated at $615,793, approximately $422 per square foot. 20 Hazel St is a home located in Essex County with nearby schools including Saltonstall School, Carlton Elementary School, and Bates Elementary School.
Ownership History
Date
Name
Owned For
Owner Type
Purchase Details
Closed on
Mar 22, 2013
Sold by
Thorng Rotana
Bought by
Thorng Rotana and Thorng Kakada K
Current Estimated Value
Purchase Details
Closed on
Nov 28, 2012
Sold by
Johnson Damian A
Bought by
Federal National Mortgage Association
Purchase Details
Closed on
Nov 30, 2004
Sold by
Roy Gregory J and Wilson Patricia L
Bought by
Haxhiaj Xhevahir and Haxhiaj Matilda
Home Financials for this Owner
Home Financials are based on the most recent Mortgage that was taken out on this home.
Original Mortgage
$245,600
Interest Rate
5.75%
Mortgage Type
Purchase Money Mortgage
Purchase Details
Closed on
Dec 29, 1994
Sold by
Roy George J and Roy Patricia
Bought by
Roy Gregory J and Roy Cheryl
Create a Home Valuation Report for This Property
The Home Valuation Report is an in-depth analysis detailing your home's value as well as a comparison with similar homes in the area
Home Values in the Area
Average Home Value in this Area
Purchase History
| Date | Buyer | Sale Price | Title Company |
|---|---|---|---|
| Thorng Rotana | -- | -- | |
| Federal National Mortgage Association | $216,101 | -- | |
| Haxhiaj Xhevahir | $307,000 | -- | |
| Roy Gregory J | $125,000 | -- |
Source: Public Records
Mortgage History
| Date | Status | Borrower | Loan Amount |
|---|---|---|---|
| Previous Owner | Roy Gregory J | $50,000 | |
| Previous Owner | Roy Gregory J | $245,600 | |
| Previous Owner | Roy Gregory J | $30,700 |
Source: Public Records
Tax History
| Year | Tax Paid | Tax Assessment Tax Assessment Total Assessment is a certain percentage of the fair market value that is determined by local assessors to be the total taxable value of land and additions on the property. | Land | Improvement |
|---|---|---|---|---|
| 2025 | $5,647 | $498,000 | $162,000 | $336,000 |
| 2024 | $5,522 | $475,200 | $153,500 | $321,700 |
| 2023 | $5,269 | $421,200 | $142,100 | $279,100 |
| 2022 | $5,164 | $389,700 | $133,600 | $256,100 |
| 2021 | $4,946 | $358,400 | $133,600 | $224,800 |
| 2020 | $4,868 | $336,900 | $115,400 | $221,500 |
| 2019 | $4,856 | $321,600 | $109,700 | $211,900 |
| 2018 | $4,660 | $303,000 | $104,600 | $198,400 |
| 2017 | $4,347 | $274,100 | $85,300 | $188,800 |
| 2016 | $4,132 | $263,700 | $80,700 | $183,000 |
| 2015 | $4,035 | $245,900 | $72,800 | $173,100 |
Source: Public Records
Map
Nearby Homes
- 10 Hazel St Unit 2
- 13 Roslyn St Unit 2
- 4 Willow Ave Unit 2
- 29 Ocean Ave Unit 4
- 24 Wisteria St Unit 2
- 7 Fairfield St
- 59 Leach St Unit 2
- 326 Lafayette St Unit 2
- 3 Chase St
- 1 Shore Ave
- 9 Glover St Unit 1
- 185 Lafayette St Unit 3
- 259 Jefferson Ave
- 263 Jefferson Ave
- 106 Broadway Unit 3
- 6 Arthur St Unit 3
- 88 Congress St Unit 3
- 22 Prescott St Unit 1
- 29 Willson St
- 15 Phelps St Unit 1
Your Personal Tour Guide
Ask me questions while you tour the home.