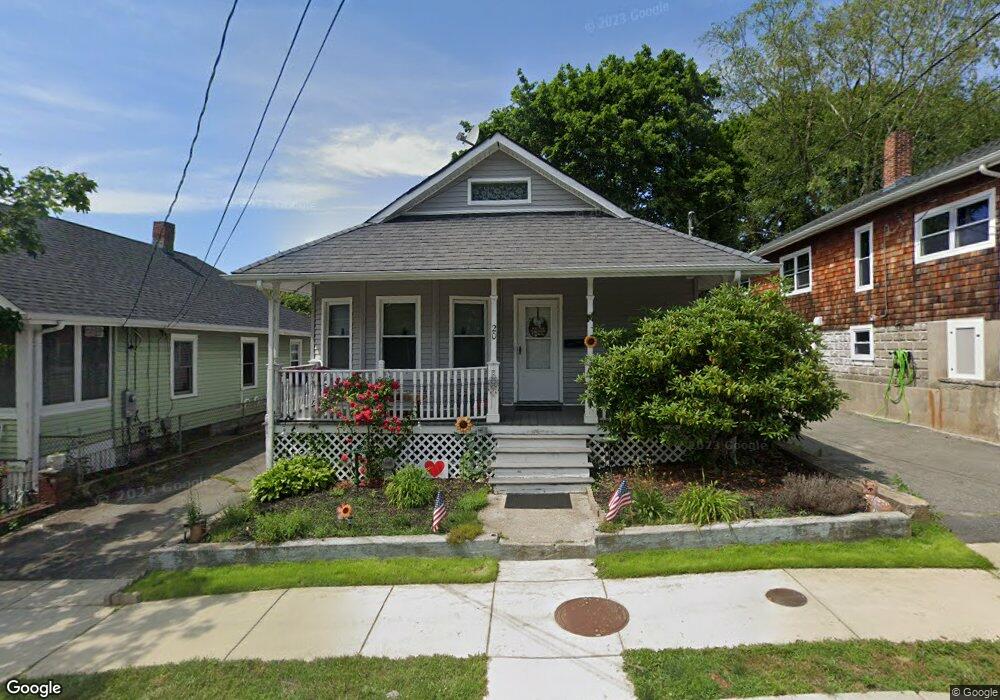
20 Hedge St Fairhaven, MA 02719
Oxford NeighborhoodEstimated Value: $416,536 - $467,000
3
Beds
1
Bath
1,036
Sq Ft
$426/Sq Ft
Est. Value
About This Home
This home is located at 20 Hedge St, Fairhaven, MA 02719 and is currently estimated at $441,134, approximately $425 per square foot. 20 Hedge St is a home located in Bristol County with nearby schools including Fairhaven High School, Alma Del Mar Charter School, and City On A Hill Charter Public School New Bedford.
Ownership History
Date
Name
Owned For
Owner Type
Purchase Details
Closed on
Dec 16, 2024
Sold by
Kumor John S and Kumor Carole L
Bought by
Kumor Carole L
Current Estimated Value
Home Financials for this Owner
Home Financials are based on the most recent Mortgage that was taken out on this home.
Original Mortgage
$103,843
Outstanding Balance
$103,029
Interest Rate
6.81%
Mortgage Type
Stand Alone Refi Refinance Of Original Loan
Estimated Equity
$338,105
Create a Home Valuation Report for This Property
The Home Valuation Report is an in-depth analysis detailing your home's value as well as a comparison with similar homes in the area
Home Values in the Area
Average Home Value in this Area
Purchase History
| Date | Buyer | Sale Price | Title Company |
|---|---|---|---|
| Kumor Carole L | -- | None Available | |
| Kumor Carole L | -- | None Available |
Source: Public Records
Mortgage History
| Date | Status | Borrower | Loan Amount |
|---|---|---|---|
| Open | Kumor Carole L | $103,843 | |
| Closed | Kumor Carole L | $103,843 |
Source: Public Records
Tax History
| Year | Tax Paid | Tax Assessment Tax Assessment Total Assessment is a certain percentage of the fair market value that is determined by local assessors to be the total taxable value of land and additions on the property. | Land | Improvement |
|---|---|---|---|---|
| 2025 | $30 | $327,100 | $169,200 | $157,900 |
| 2024 | $2,945 | $319,100 | $169,200 | $149,900 |
| 2023 | $2,871 | $288,500 | $148,200 | $140,300 |
| 2022 | $2,783 | $272,300 | $137,700 | $134,600 |
| 2021 | $2,653 | $235,000 | $124,600 | $110,400 |
| 2020 | $2,599 | $235,000 | $124,600 | $110,400 |
| 2019 | $3,439 | $205,100 | $103,300 | $101,800 |
| 2018 | $165 | $195,100 | $98,300 | $96,800 |
| 2017 | $2,266 | $188,200 | $98,300 | $89,900 |
| 2016 | $2,200 | $180,600 | $98,300 | $82,300 |
| 2015 | $2,176 | $179,100 | $98,300 | $80,800 |
Source: Public Records
Map
Nearby Homes
- 442 Dana Farms
- 14 Sycamore St
- 313 Main St
- 24 Academy Ave
- 253 Adams St
- 10 Livesey Pkwy
- 138 Main St Unit 13
- 71 Sycamore St
- 15 School St
- 16 Ash St
- 34 Washburn St Unit 36
- 24 Cotter St
- 67 Bridge St
- 39 Christian St
- 239 Sawyer St
- 1301 Pleasant St Unit 1305
- 77 Adams St
- 1441 Pleasant St
- 8 Washington St
- 272 Sawyer St
Your Personal Tour Guide
Ask me questions while you tour the home.