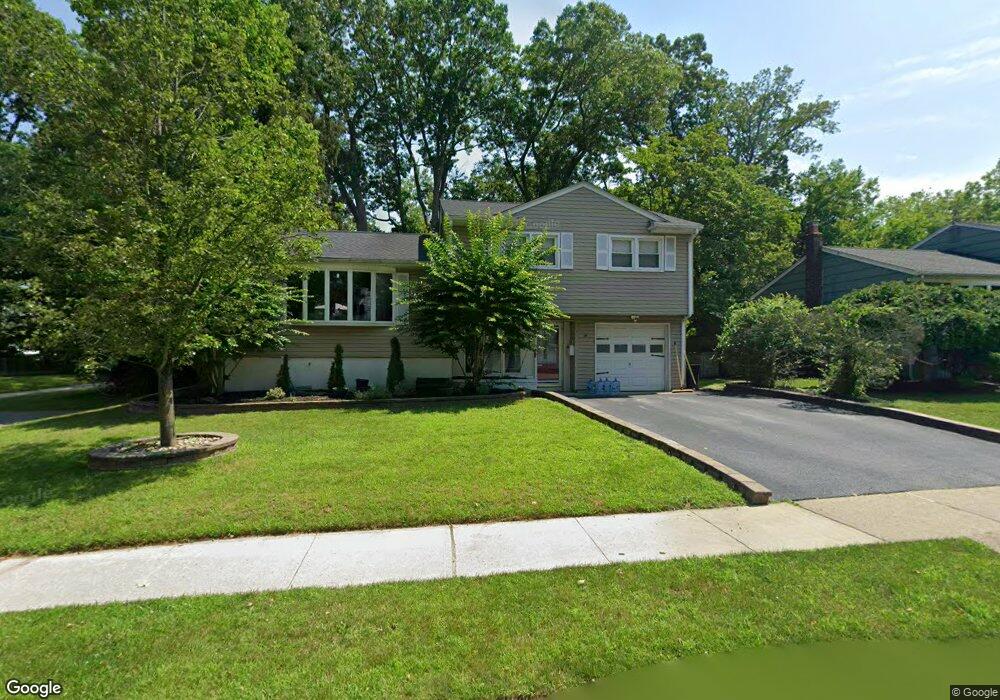
20 Henderson Ct Pompton Lakes, NJ 07442
Estimated Value: $517,000 - $616,000
--
Bed
--
Bath
1,604
Sq Ft
$357/Sq Ft
Est. Value
About This Home
This home is located at 20 Henderson Ct, Pompton Lakes, NJ 07442 and is currently estimated at $573,110, approximately $357 per square foot. 20 Henderson Ct is a home located in Passaic County with nearby schools including Pompton Lakes High School and St Marys School.
Ownership History
Date
Name
Owned For
Owner Type
Purchase Details
Closed on
Jul 15, 2011
Sold by
Dunn Lowell Andrew and Dunn Kathleen
Bought by
Fabrian Fernando and Fabrian Stephanie
Current Estimated Value
Home Financials for this Owner
Home Financials are based on the most recent Mortgage that was taken out on this home.
Original Mortgage
$307,014
Outstanding Balance
$211,117
Interest Rate
4.5%
Mortgage Type
FHA
Estimated Equity
$361,993
Purchase Details
Closed on
Feb 8, 1994
Sold by
Forman Michael
Bought by
Dunn Lowell and Dunn Kathleen
Create a Home Valuation Report for This Property
The Home Valuation Report is an in-depth analysis detailing your home's value as well as a comparison with similar homes in the area
Home Values in the Area
Average Home Value in this Area
Purchase History
| Date | Buyer | Sale Price | Title Company |
|---|---|---|---|
| Fabrian Fernando | $315,000 | -- | |
| Dunn Lowell | $153,000 | -- |
Source: Public Records
Mortgage History
| Date | Status | Borrower | Loan Amount |
|---|---|---|---|
| Open | Fabrian Fernando | $307,014 |
Source: Public Records
Tax History Compared to Growth
Tax History
| Year | Tax Paid | Tax Assessment Tax Assessment Total Assessment is a certain percentage of the fair market value that is determined by local assessors to be the total taxable value of land and additions on the property. | Land | Improvement |
|---|---|---|---|---|
| 2025 | $10,989 | $278,700 | $121,200 | $157,500 |
| 2024 | $10,688 | $278,700 | $121,200 | $157,500 |
| 2022 | $10,607 | $278,700 | $121,200 | $157,500 |
| 2021 | $10,493 | $278,700 | $121,200 | $157,500 |
| 2020 | $10,471 | $278,700 | $121,200 | $157,500 |
| 2019 | $10,226 | $278,700 | $121,200 | $157,500 |
| 2018 | $10,047 | $278,700 | $121,200 | $157,500 |
| 2017 | $10,355 | $148,900 | $52,700 | $96,200 |
| 2016 | $10,241 | $148,900 | $52,700 | $96,200 |
| 2015 | $10,173 | $148,900 | $52,700 | $96,200 |
| 2014 | $9,878 | $148,900 | $52,700 | $96,200 |
Source: Public Records
Map
Nearby Homes