20 Hickory Ave Moundsville, WV 26041
Estimated Value: $121,000 - $139,000
3
Beds
2
Baths
2,340
Sq Ft
$55/Sq Ft
Est. Value
About This Home
This home is located at 20 Hickory Ave, Moundsville, WV 26041 and is currently estimated at $128,536, approximately $54 per square foot. 20 Hickory Ave is a home located in Marshall County with nearby schools including Moundsville Christian School and St. Francis Xavier School.
Ownership History
Date
Name
Owned For
Owner Type
Purchase Details
Closed on
Aug 9, 2017
Sold by
Pill And Pill Pllc
Bought by
Tucker Kenneth D and Tucker Sharon D
Current Estimated Value
Purchase Details
Closed on
May 25, 2005
Sold by
Jones Paula A
Bought by
Blake Lane A and Blake Deanna L
Home Financials for this Owner
Home Financials are based on the most recent Mortgage that was taken out on this home.
Original Mortgage
$81,000
Interest Rate
9.41%
Mortgage Type
Adjustable Rate Mortgage/ARM
Create a Home Valuation Report for This Property
The Home Valuation Report is an in-depth analysis detailing your home's value as well as a comparison with similar homes in the area
Home Values in the Area
Average Home Value in this Area
Purchase History
| Date | Buyer | Sale Price | Title Company |
|---|---|---|---|
| Tucker Kenneth D | $18,324 | None Available | |
| Blake Lane A | $99,000 | None Available |
Source: Public Records
Mortgage History
| Date | Status | Borrower | Loan Amount |
|---|---|---|---|
| Previous Owner | Blake Lane A | $81,000 |
Source: Public Records
Tax History Compared to Growth
Tax History
| Year | Tax Paid | Tax Assessment Tax Assessment Total Assessment is a certain percentage of the fair market value that is determined by local assessors to be the total taxable value of land and additions on the property. | Land | Improvement |
|---|---|---|---|---|
| 2025 | $1,281 | $51,600 | $9,300 | $42,300 |
| 2024 | $1,281 | $50,040 | $9,300 | $40,740 |
| 2023 | $1,243 | $50,040 | $9,300 | $40,740 |
| 2022 | $1,267 | $50,040 | $9,300 | $40,740 |
| 2021 | $1,253 | $50,160 | $9,300 | $40,860 |
| 2020 | $1,190 | $47,340 | $9,300 | $38,040 |
| 2019 | $1,128 | $44,520 | $8,280 | $36,240 |
| 2018 | $557 | $43,980 | $8,280 | $35,700 |
| 2017 | $545 | $41,880 | $7,800 | $34,080 |
| 2016 | $520 | $40,860 | $7,560 | $33,300 |
| 2015 | $495 | $38,460 | $8,040 | $30,420 |
| 2014 | $491 | $37,380 | $6,960 | $30,420 |
Source: Public Records
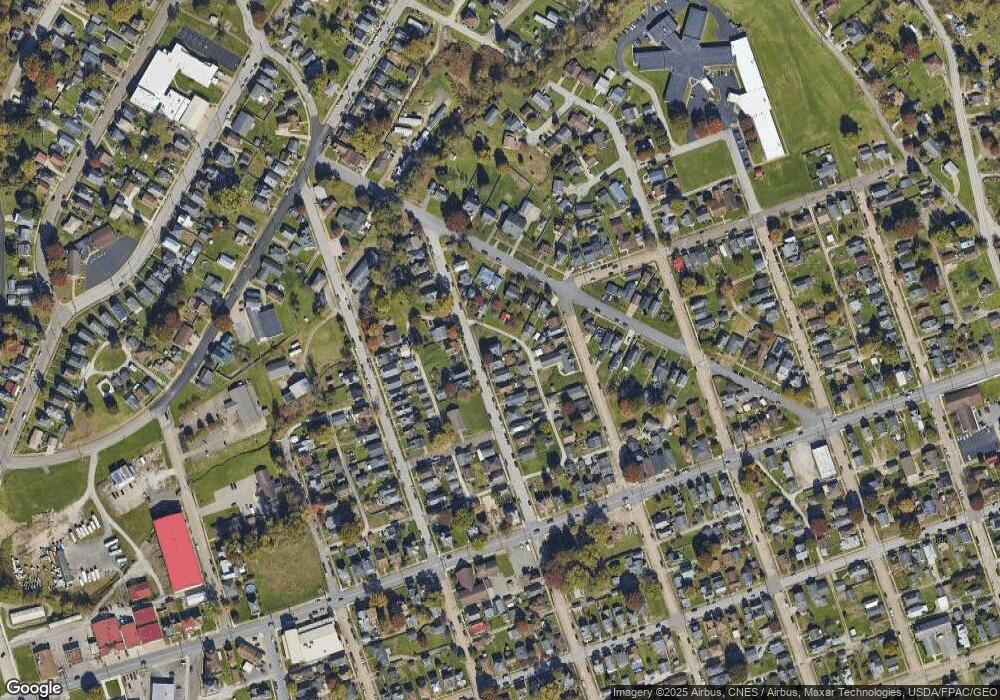
Map
Nearby Homes