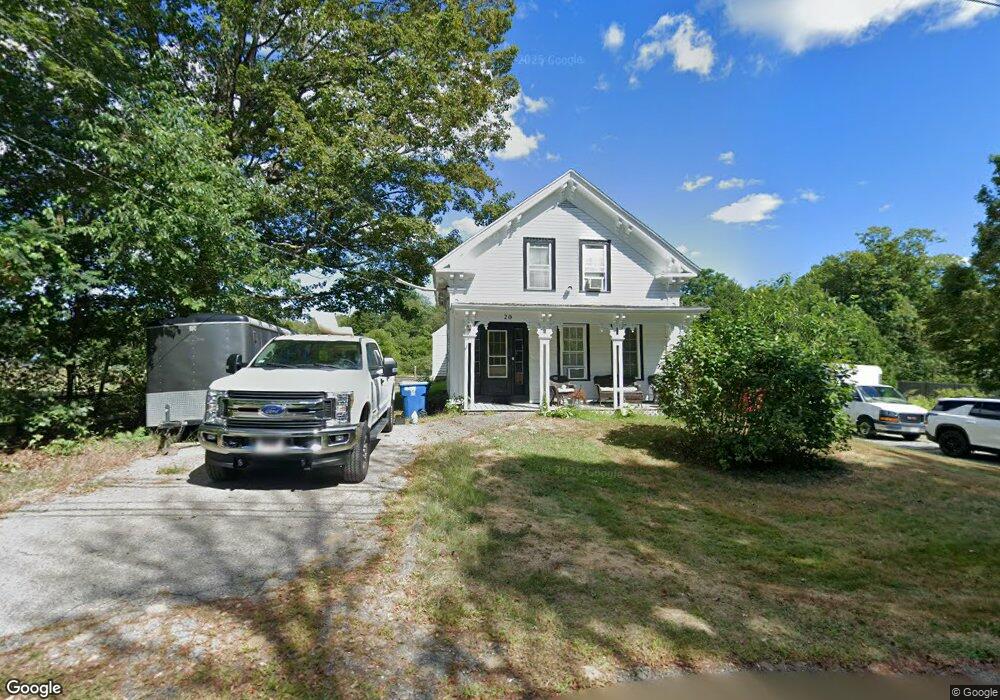
20 High St Unit 20 Hubbardston, MA 01452
Estimated Value: $283,000 - $384,000
4
Beds
1
Bath
1,584
Sq Ft
$222/Sq Ft
Est. Value
About This Home
This home is located at 20 High St Unit 20, Hubbardston, MA 01452 and is currently estimated at $351,402, approximately $221 per square foot. 20 High St Unit 20 is a home located in Worcester County with nearby schools including Quabbin Regional Middle School and Quabbin Regional High School.
Ownership History
Date
Name
Owned For
Owner Type
Purchase Details
Closed on
Aug 5, 2011
Sold by
M & T Bank
Bought by
Dibuono Thomas J and Dibuono Anne R
Current Estimated Value
Purchase Details
Closed on
May 19, 2011
Sold by
Silva and Silva Kevin J
Bought by
M & T Bank
Purchase Details
Closed on
Sep 15, 2004
Sold by
Leadbetter Penrose N
Bought by
Silva Edith A and Silva Kevin J
Home Financials for this Owner
Home Financials are based on the most recent Mortgage that was taken out on this home.
Original Mortgage
$186,400
Interest Rate
6.02%
Mortgage Type
Purchase Money Mortgage
Purchase Details
Closed on
Jul 30, 2004
Sold by
Leadbetter Brian J and Leadbetter Terri R
Bought by
Silva Edith A and Silva Kevin J
Home Financials for this Owner
Home Financials are based on the most recent Mortgage that was taken out on this home.
Original Mortgage
$186,400
Interest Rate
6.02%
Mortgage Type
Purchase Money Mortgage
Purchase Details
Closed on
Aug 8, 1997
Sold by
Desisto Dona L
Bought by
Leadbetter Penrose N and Leadbetter Alfreda
Create a Home Valuation Report for This Property
The Home Valuation Report is an in-depth analysis detailing your home's value as well as a comparison with similar homes in the area
Home Values in the Area
Average Home Value in this Area
Purchase History
| Date | Buyer | Sale Price | Title Company |
|---|---|---|---|
| Dibuono Thomas J | $88,000 | -- | |
| M & T Bank | -- | -- | |
| M & T Bank | $138,680 | -- | |
| Silva Edith A | -- | -- | |
| Silva Edith A | -- | -- | |
| Leadbetter Penrose N | $1,000 | -- |
Source: Public Records
Mortgage History
| Date | Status | Borrower | Loan Amount |
|---|---|---|---|
| Previous Owner | Silva Edith A | $186,400 | |
| Previous Owner | Leadbetter Penrose N | $50,000 |
Source: Public Records
Tax History Compared to Growth
Tax History
| Year | Tax Paid | Tax Assessment Tax Assessment Total Assessment is a certain percentage of the fair market value that is determined by local assessors to be the total taxable value of land and additions on the property. | Land | Improvement |
|---|---|---|---|---|
| 2025 | $3,481 | $298,000 | $30,400 | $267,600 |
| 2024 | $3,307 | $280,500 | $28,900 | $251,600 |
| 2023 | $2,361 | $181,200 | $25,300 | $155,900 |
| 2022 | $2,537 | $181,200 | $25,300 | $155,900 |
| 2021 | $2,464 | $166,400 | $25,300 | $141,100 |
| 2020 | $2,324 | $156,800 | $25,300 | $131,500 |
| 2019 | $8 | $161,400 | $42,700 | $118,700 |
| 2018 | $3,972 | $158,200 | $42,700 | $115,500 |
| 2017 | $2,409 | $158,200 | $42,700 | $115,500 |
| 2016 | $2,415 | $151,900 | $42,700 | $109,200 |
| 2015 | $2,547 | $170,700 | $42,700 | $128,000 |
| 2014 | $2,544 | $175,200 | $42,700 | $132,500 |
Source: Public Records
Map
Nearby Homes
- 7 Williamsville Rd
- 1 Barre Road Cut Off
- 63 Gardner Rd
- Lot 0 Old Westminster Rd
- 75 Barre Rd
- 105 Hale Rd
- 45 Old Colony Rd
- 65 Victoria Ln
- 5 Kurikka Place
- 3 Gary Rd
- 0 Williamsville Rd
- 277 Lovewell St
- 85 Marsh Rd
- 99 Turner Ln
- 171 South Rd
- 283 Mill St
- 21 Plymouth St
- 77 Lovewell St
- 56 Hubbardston Rd
- 0 Mill St