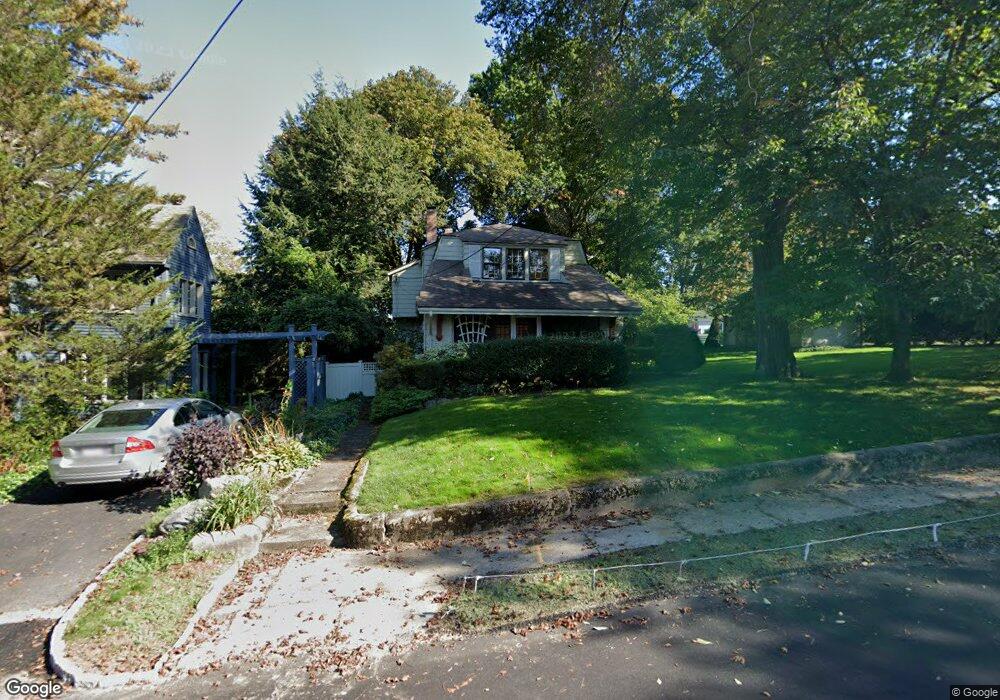
20 Highland Rd Belmont, MA 02478
Belmont Center NeighborhoodEstimated Value: $1,680,000 - $1,945,000
4
Beds
3
Baths
2,099
Sq Ft
$851/Sq Ft
Est. Value
About This Home
This home is located at 20 Highland Rd, Belmont, MA 02478 and is currently estimated at $1,785,777, approximately $850 per square foot. 20 Highland Rd is a home located in Middlesex County with nearby schools including Roger Wellington Elementary School, Winthrop L Chenery Middle School, and Belmont High School.
Ownership History
Date
Name
Owned For
Owner Type
Purchase Details
Closed on
Mar 5, 2013
Sold by
Richard C Mcfarland Re and Mcfarland Richard C
Bought by
Mcfarland Richard C and Brown Yvonne
Current Estimated Value
Home Financials for this Owner
Home Financials are based on the most recent Mortgage that was taken out on this home.
Original Mortgage
$386,000
Outstanding Balance
$78,845
Interest Rate
3.43%
Mortgage Type
New Conventional
Estimated Equity
$1,706,932
Purchase Details
Closed on
Aug 1, 2000
Sold by
Davis Hallette C
Bought by
Mcfarland Richard C and Brown Yvonne
Home Financials for this Owner
Home Financials are based on the most recent Mortgage that was taken out on this home.
Original Mortgage
$556,000
Interest Rate
8.18%
Mortgage Type
Purchase Money Mortgage
Create a Home Valuation Report for This Property
The Home Valuation Report is an in-depth analysis detailing your home's value as well as a comparison with similar homes in the area
Home Values in the Area
Average Home Value in this Area
Purchase History
| Date | Buyer | Sale Price | Title Company |
|---|---|---|---|
| Mcfarland Richard C | -- | -- | |
| Mcfarland Richard C | $695,000 | -- |
Source: Public Records
Mortgage History
| Date | Status | Borrower | Loan Amount |
|---|---|---|---|
| Open | Mcfarland Richard C | $386,000 | |
| Previous Owner | Mcfarland Richard C | $417,000 | |
| Previous Owner | Mcfarland Richard C | $292,000 | |
| Previous Owner | Mcfarland Richard C | $350,000 | |
| Previous Owner | Mcfarland Richard C | $556,000 |
Source: Public Records
Tax History Compared to Growth
Tax History
| Year | Tax Paid | Tax Assessment Tax Assessment Total Assessment is a certain percentage of the fair market value that is determined by local assessors to be the total taxable value of land and additions on the property. | Land | Improvement |
|---|---|---|---|---|
| 2025 | $17,837 | $1,566,000 | $1,043,000 | $523,000 |
| 2024 | $17,762 | $1,682,000 | $1,300,000 | $382,000 |
| 2023 | $15,399 | $1,370,000 | $991,000 | $379,000 |
| 2022 | $14,887 | $1,263,000 | $907,000 | $356,000 |
| 2021 | $14,887 | $1,290,000 | $993,000 | $297,000 |
| 2020 | $15,136 | $1,376,000 | $1,059,000 | $317,000 |
| 2019 | $13,724 | $1,176,000 | $826,000 | $350,000 |
| 2018 | $12,369 | $1,018,000 | $668,000 | $350,000 |
| 2017 | $12,208 | $962,000 | $612,000 | $350,000 |
| 2016 | $12,045 | $959,000 | $612,000 | $347,000 |
| 2015 | $10,630 | $824,000 | $523,000 | $301,000 |
Source: Public Records
Map
Nearby Homes
- 263 Common St
- 38 Myrtle St
- 1 Spinney Terrace
- 36 Madison St
- 69 Horace Rd
- 66 Channing Rd
- 105 Watson Rd
- 160 Waverley St
- 59-61 Gilbert Rd
- 72-74 Flett Rd
- 33 Slade St Unit 1
- 23 Centre Ave
- 125 Trapelo Rd Unit 21
- 125 Trapelo Rd Unit 23
- 48 Concord Ave
- 55-57 Hawthorne St
- 73 Trowbridge St Unit 73A
- 73 Trowbridge St Unit 73B
- 48 Hamilton Rd
- 46 Hamilton Rd