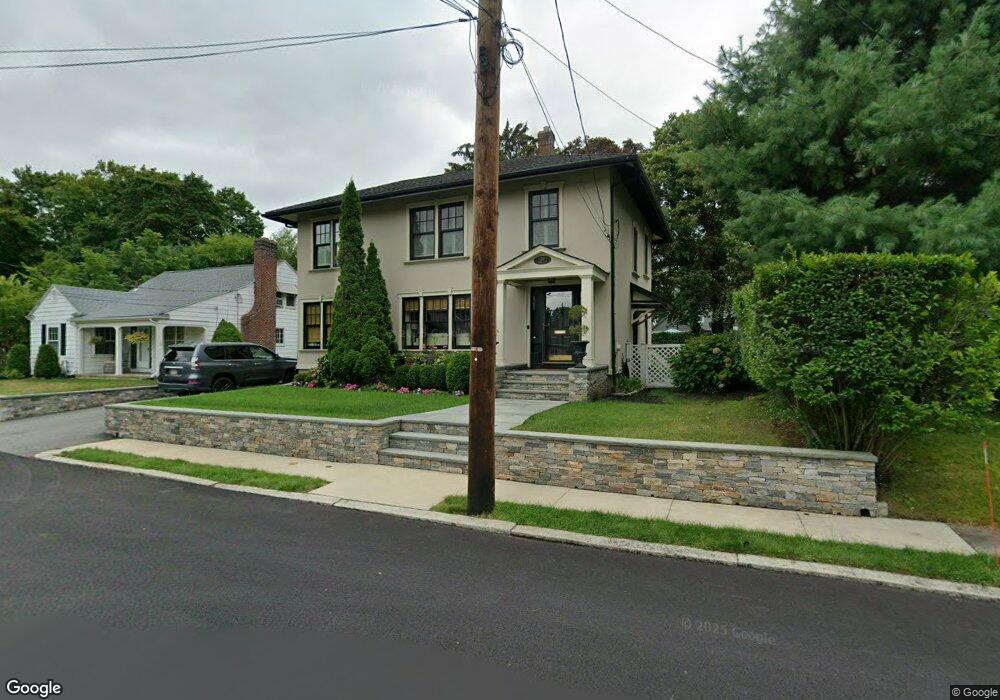
20 Hixon Ct North Attleboro, MA 02760
North Attleboro NeighborhoodEstimated Value: $541,679 - $637,000
3
Beds
2
Baths
1,746
Sq Ft
$331/Sq Ft
Est. Value
About This Home
This home is located at 20 Hixon Ct, North Attleboro, MA 02760 and is currently estimated at $578,170, approximately $331 per square foot. 20 Hixon Ct is a home located in Bristol County with nearby schools including North Attleboro High School, Cadence Academy Preschool - North Attleborough, and Bishop Feehan High School.
Ownership History
Date
Name
Owned For
Owner Type
Purchase Details
Closed on
Sep 30, 1997
Sold by
Olive F Nolin Lt
Bought by
Mcgovern Charles F and Mcgovern Patricia A
Current Estimated Value
Home Financials for this Owner
Home Financials are based on the most recent Mortgage that was taken out on this home.
Original Mortgage
$117,000
Outstanding Balance
$18,830
Interest Rate
7.47%
Mortgage Type
Purchase Money Mortgage
Estimated Equity
$559,340
Create a Home Valuation Report for This Property
The Home Valuation Report is an in-depth analysis detailing your home's value as well as a comparison with similar homes in the area
Home Values in the Area
Average Home Value in this Area
Purchase History
| Date | Buyer | Sale Price | Title Company |
|---|---|---|---|
| Mcgovern Charles F | $130,000 | -- |
Source: Public Records
Mortgage History
| Date | Status | Borrower | Loan Amount |
|---|---|---|---|
| Open | Mcgovern Charles F | $117,000 |
Source: Public Records
Tax History Compared to Growth
Tax History
| Year | Tax Paid | Tax Assessment Tax Assessment Total Assessment is a certain percentage of the fair market value that is determined by local assessors to be the total taxable value of land and additions on the property. | Land | Improvement |
|---|---|---|---|---|
| 2025 | $5,723 | $485,400 | $115,200 | $370,200 |
| 2024 | $5,449 | $472,200 | $115,200 | $357,000 |
| 2023 | $5,276 | $412,500 | $120,200 | $292,300 |
| 2022 | $5,147 | $369,500 | $115,200 | $254,300 |
| 2021 | $4,952 | $347,000 | $115,200 | $231,800 |
| 2020 | $4,901 | $341,500 | $115,200 | $226,300 |
| 2019 | $4,584 | $321,900 | $104,700 | $217,200 |
| 2018 | $4,051 | $303,700 | $104,700 | $199,000 |
| 2017 | $3,774 | $285,500 | $104,700 | $180,800 |
| 2016 | $3,585 | $271,200 | $121,400 | $149,800 |
| 2015 | $3,391 | $258,100 | $126,500 | $131,600 |
| 2014 | $3,380 | $255,300 | $111,000 | $144,300 |
Source: Public Records
Map
Nearby Homes
- 80 Broadway Unit 9
- 300 E Washington St Unit 54R
- 137 Sumner St
- 93 Bank St
- 50 Metcalf Rd
- 16 Richards Ave Unit 106
- 130 E Washington St Unit 71
- 130 E Washington St Unit 36
- 160 Crescent Ave
- 40 Roosevelt Ave
- 19 Church St Unit C9
- 12 Roosevelt Ave
- 16 Johnson St
- 27 Taylor St
- 46 Westside Ave
- 0 Anawan Rd
- 880 Landry Ave Unit 2
- 42 2nd Ave Unit 24
- 30 Sperry Ln Unit Lot 15
- 304 Elm St