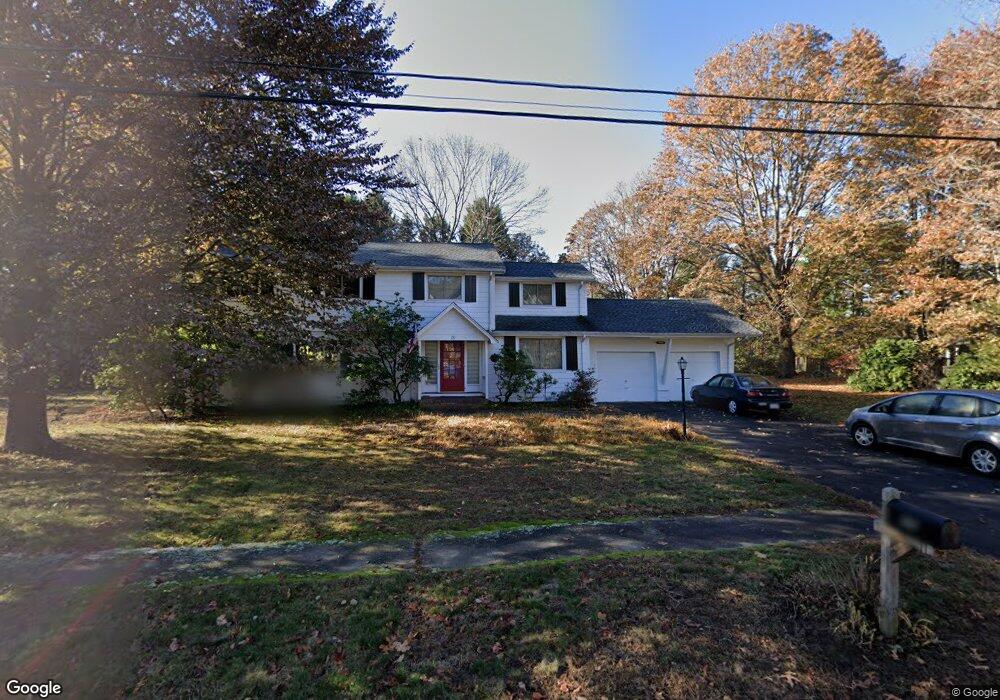
20 Holmes Rd Unit 20,20 Lexington, MA 02420
Munroe Hill NeighborhoodEstimated Value: $1,657,947 - $1,952,000
5
Beds
3
Baths
2,400
Sq Ft
$728/Sq Ft
Est. Value
About This Home
This home is located at 20 Holmes Rd Unit 20,20, Lexington, MA 02420 and is currently estimated at $1,746,987, approximately $727 per square foot. 20 Holmes Rd Unit 20,20 is a home located in Middlesex County with nearby schools including Fiske Elementary School, William Diamond Middle School, and Lexington High School.
Ownership History
Date
Name
Owned For
Owner Type
Purchase Details
Closed on
Dec 10, 2013
Sold by
Taylor Frank E and Taylor Ellen K
Bought by
Frank E Taylor Ret
Current Estimated Value
Purchase Details
Closed on
Aug 22, 1991
Sold by
Gelotte William A and Gelotte Ellen K
Bought by
Taylor Frank E and Taylor Ellen K
Home Financials for this Owner
Home Financials are based on the most recent Mortgage that was taken out on this home.
Original Mortgage
$191,250
Interest Rate
9.55%
Mortgage Type
Purchase Money Mortgage
Create a Home Valuation Report for This Property
The Home Valuation Report is an in-depth analysis detailing your home's value as well as a comparison with similar homes in the area
Home Values in the Area
Average Home Value in this Area
Purchase History
| Date | Buyer | Sale Price | Title Company |
|---|---|---|---|
| Frank E Taylor Ret | -- | -- | |
| Taylor Frank E | $380,000 | -- |
Source: Public Records
Mortgage History
| Date | Status | Borrower | Loan Amount |
|---|---|---|---|
| Previous Owner | Taylor Frank E | $203,150 | |
| Previous Owner | Taylor Frank E | $202,300 | |
| Previous Owner | Taylor Frank E | $191,250 |
Source: Public Records
Tax History Compared to Growth
Tax History
| Year | Tax Paid | Tax Assessment Tax Assessment Total Assessment is a certain percentage of the fair market value that is determined by local assessors to be the total taxable value of land and additions on the property. | Land | Improvement |
|---|---|---|---|---|
| 2025 | $17,648 | $1,443,000 | $802,000 | $641,000 |
| 2024 | $17,187 | $1,403,000 | $764,000 | $639,000 |
| 2023 | $16,835 | $1,295,000 | $695,000 | $600,000 |
| 2022 | $15,870 | $1,150,000 | $632,000 | $518,000 |
| 2021 | $9,775 | $1,078,000 | $602,000 | $476,000 |
| 2020 | $15,005 | $1,068,000 | $602,000 | $466,000 |
| 2019 | $14,388 | $1,019,000 | $573,000 | $446,000 |
| 2018 | $6,320 | $984,000 | $546,000 | $438,000 |
| 2017 | $12,215 | $843,000 | $520,000 | $323,000 |
| 2016 | $11,855 | $812,000 | $496,000 | $316,000 |
| 2015 | $11,591 | $780,000 | $450,000 | $330,000 |
| 2014 | $12,144 | $783,000 | $409,000 | $374,000 |
Source: Public Records
Map
Nearby Homes