Estimated Value: $283,000 - $315,000
--
Bed
2
Baths
1,859
Sq Ft
$162/Sq Ft
Est. Value
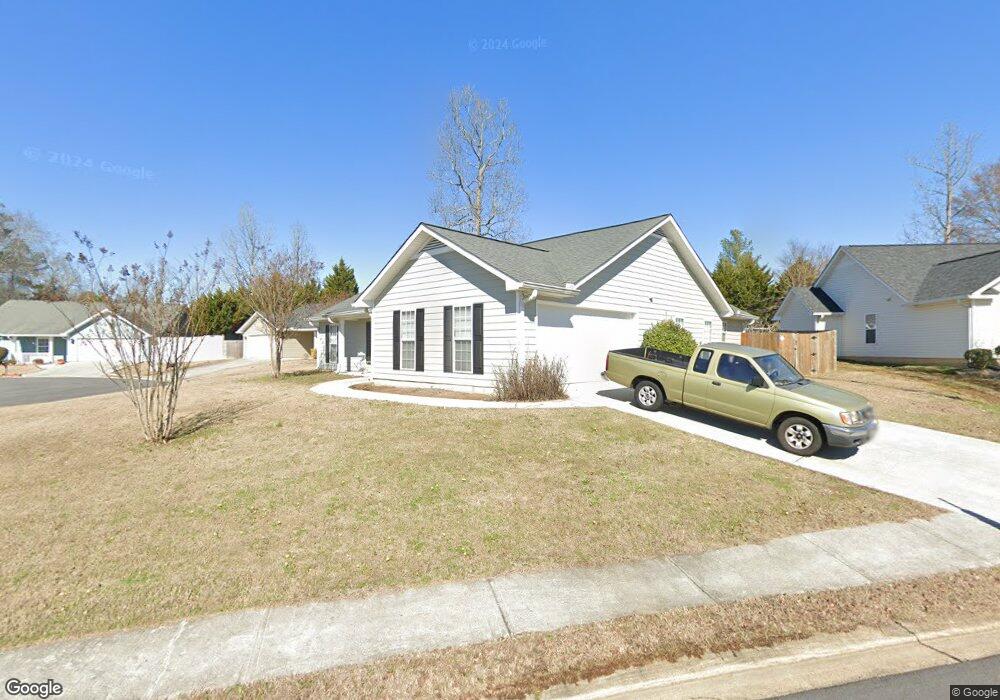
About This Home
This home is located at 20 Honeyree Trail, Rome, GA 30165 and is currently estimated at $300,353, approximately $161 per square foot. 20 Honeyree Trail is a home located in Floyd County with nearby schools including Armuchee Middle School, Armuchee High School, and Unity Christian School.
Ownership History
Date
Name
Owned For
Owner Type
Purchase Details
Closed on
Mar 9, 2021
Sold by
Strange Brandon
Bought by
Bach Courtney N
Current Estimated Value
Home Financials for this Owner
Home Financials are based on the most recent Mortgage that was taken out on this home.
Original Mortgage
$162,000
Outstanding Balance
$145,295
Interest Rate
2.73%
Mortgage Type
New Conventional
Estimated Equity
$155,058
Purchase Details
Closed on
Jan 29, 2018
Sold by
Patel Sombhai D
Bought by
Strange Brandon Lee and Strange Lauren
Home Financials for this Owner
Home Financials are based on the most recent Mortgage that was taken out on this home.
Original Mortgage
$135,800
Interest Rate
3.99%
Mortgage Type
New Conventional
Purchase Details
Closed on
Jan 8, 2004
Sold by
Patrick Cash Homes Inc
Bought by
Patel Sombhai D and Patel Niruben S
Purchase Details
Closed on
Jun 3, 2003
Sold by
27 East Llc
Bought by
Patrick Cash Homes Inc
Purchase Details
Closed on
Apr 23, 1998
Bought by
27 East Llc
Create a Home Valuation Report for This Property
The Home Valuation Report is an in-depth analysis detailing your home's value as well as a comparison with similar homes in the area
Home Values in the Area
Average Home Value in this Area
Purchase History
| Date | Buyer | Sale Price | Title Company |
|---|---|---|---|
| Bach Courtney N | $180,000 | -- | |
| Strange Brandon Lee | $140,000 | -- | |
| Patel Sombhai D | $152,000 | -- | |
| Patrick Cash Homes Inc | $24,000 | -- | |
| 27 East Llc | -- | -- |
Source: Public Records
Mortgage History
| Date | Status | Borrower | Loan Amount |
|---|---|---|---|
| Open | Bach Courtney N | $162,000 | |
| Previous Owner | Strange Brandon Lee | $135,800 |
Source: Public Records
Tax History Compared to Growth
Tax History
| Year | Tax Paid | Tax Assessment Tax Assessment Total Assessment is a certain percentage of the fair market value that is determined by local assessors to be the total taxable value of land and additions on the property. | Land | Improvement |
|---|---|---|---|---|
| 2024 | $3,463 | $128,499 | $10,080 | $118,419 |
| 2023 | $3,465 | $112,467 | $10,080 | $102,387 |
| 2022 | $2,202 | $95,413 | $9,600 | $85,813 |
| 2021 | $2,146 | $74,476 | $9,600 | $64,876 |
| 2020 | $2,056 | $68,767 | $9,600 | $59,167 |
| 2019 | $1,738 | $65,338 | $9,600 | $55,738 |
| 2018 | $1,017 | $60,135 | $9,600 | $50,535 |
| 2017 | $909 | $54,656 | $9,600 | $45,056 |
| 2016 | $802 | $50,784 | $9,600 | $41,184 |
| 2015 | $765 | $50,784 | $9,600 | $41,184 |
| 2014 | $765 | $50,784 | $9,600 | $41,184 |
Source: Public Records
Map
Nearby Homes
- 3 Coggins Place NE
- 3 Coggins Place NE
- 3158 Martha Berry Hwy
- KERRY Plan at Northberry
- BELHAVEN Plan at Northberry
- CALI Plan at Northberry
- ROBIE Plan at Northberry
- ARIA Plan at Northberry
- 7 Coggins Place NE
- 4 Sleepy Oaks Trail NE
- 9 Coggins Place NE
- 8 Coggins Place NE
- 5 Coggins Place NE
- 11 Coggins Place NE
- 10 Coggins Place NE
- 12 Coggins Place NE
- 13 Coggins Place NE
- 15 Coggins Place NE
- 21 Coggins Place NE
- 20 Honeytree Trail NE
- 18 Honeytree Trail NE
- 4 Sapling Ct NE
- 16 Honeytree Trail NE
- 22 Honeytree Trail NE
- 21 Honeytree Trail NE
- 21 Honeytree Trail NE Unit Tr
- 17 Honeytree Trail NE
- 5 Sapling Ct NE
- 3 Sapling Ct NE
- 14 Honeytree Trail NE
- 23 Honeytree Trail NE
- 15 Honeytree Trail NE
- 0 Gilbreath Property Unit 3564554-5775130
- 24 Honeytree Trail NE
- 12 Honeytree Trail NE
- 11 Honeytree Trail NE
- 25 Honeytree Trail NE
- 0 Honeytree Trail NE Unit 7104963
- 0 Honeytree Trail NE Unit 3270603