20 Irving Rd Natick, MA 01760
Estimated Value: $750,000 - $925,000
3
Beds
2
Baths
1,316
Sq Ft
$624/Sq Ft
Est. Value
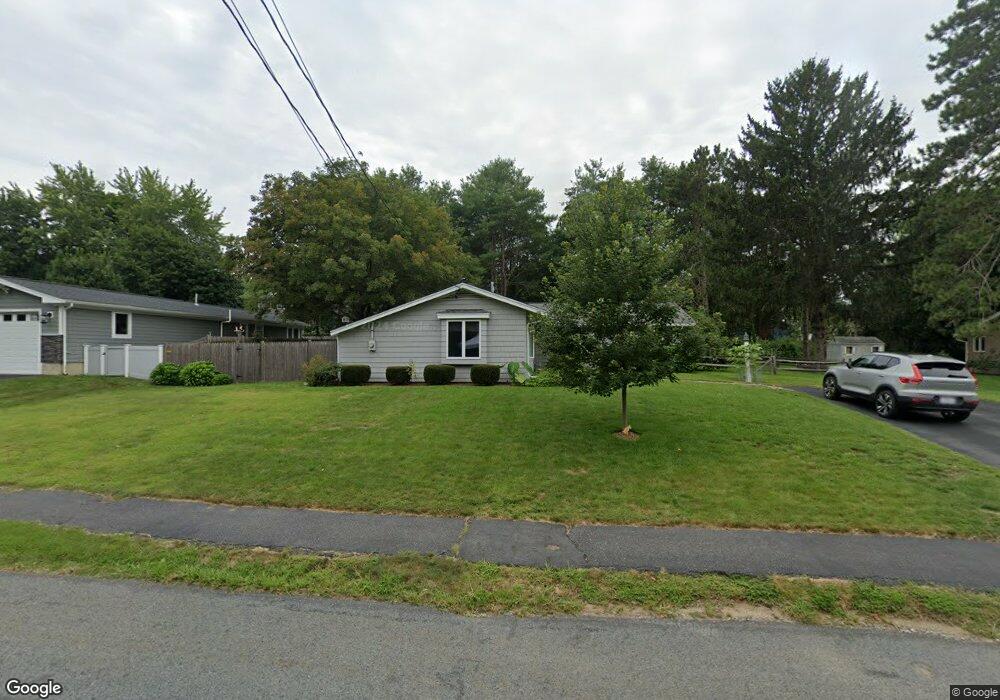
About This Home
This home is located at 20 Irving Rd, Natick, MA 01760 and is currently estimated at $821,073, approximately $623 per square foot. 20 Irving Rd is a home located in Middlesex County with nearby schools including Natick High School, Bennett-Hemenway (Ben-Hem) Elementary School, and Wilson Middle School.
Ownership History
Date
Name
Owned For
Owner Type
Purchase Details
Closed on
Nov 29, 1993
Sold by
Mangano Robert P and Mangano Ellen M
Bought by
Smith Kevin D and Durkin Patricia
Current Estimated Value
Home Financials for this Owner
Home Financials are based on the most recent Mortgage that was taken out on this home.
Original Mortgage
$125,100
Interest Rate
6.72%
Mortgage Type
Purchase Money Mortgage
Create a Home Valuation Report for This Property
The Home Valuation Report is an in-depth analysis detailing your home's value as well as a comparison with similar homes in the area
Home Values in the Area
Average Home Value in this Area
Purchase History
| Date | Buyer | Sale Price | Title Company |
|---|---|---|---|
| Smith Kevin D | $139,000 | -- |
Source: Public Records
Mortgage History
| Date | Status | Borrower | Loan Amount |
|---|---|---|---|
| Open | Smith Kevin D | $140,000 | |
| Closed | Smith Kevin D | $125,100 |
Source: Public Records
Tax History Compared to Growth
Tax History
| Year | Tax Paid | Tax Assessment Tax Assessment Total Assessment is a certain percentage of the fair market value that is determined by local assessors to be the total taxable value of land and additions on the property. | Land | Improvement |
|---|---|---|---|---|
| 2025 | $7,439 | $622,000 | $461,300 | $160,700 |
| 2024 | $7,244 | $590,900 | $435,700 | $155,200 |
| 2023 | $7,038 | $556,800 | $409,000 | $147,800 |
| 2022 | $6,842 | $512,900 | $372,300 | $140,600 |
| 2021 | $6,586 | $483,900 | $351,900 | $132,000 |
| 2020 | $3,569 | $468,600 | $336,600 | $132,000 |
| 2019 | $5,956 | $468,600 | $336,600 | $132,000 |
| 2018 | $9,104 | $400,300 | $306,000 | $94,300 |
| 2017 | $4,925 | $365,100 | $272,500 | $92,600 |
| 2016 | $4,739 | $349,200 | $257,500 | $91,700 |
| 2015 | $4,710 | $340,800 | $257,500 | $83,300 |
Source: Public Records
Map
Nearby Homes