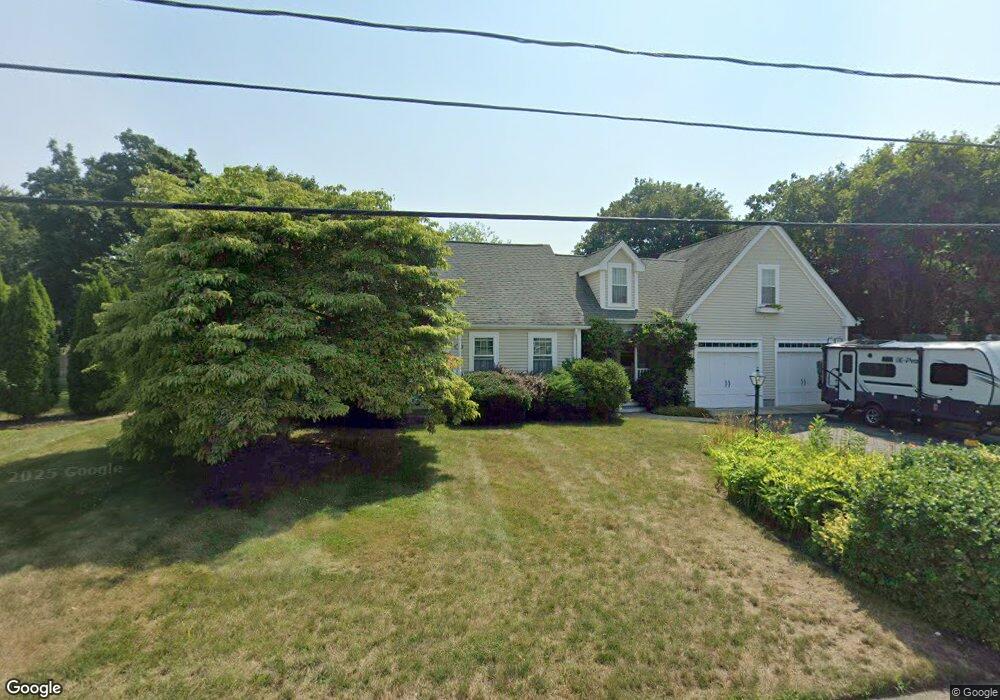
20 James St Seekonk, MA 02771
Estimated Value: $447,000 - $557,319
3
Beds
2
Baths
1,652
Sq Ft
$309/Sq Ft
Est. Value
About This Home
This home is located at 20 James St, Seekonk, MA 02771 and is currently estimated at $510,330, approximately $308 per square foot. 20 James St is a home located in Bristol County with nearby schools including Seekonk High School, St Mary Academy-Bay View, and Providence Country Day School.
Ownership History
Date
Name
Owned For
Owner Type
Purchase Details
Closed on
Nov 28, 1997
Sold by
Harris Richard J and Harris Susan F
Bought by
Turcotte Ronald A and Turcotte Margaret T
Current Estimated Value
Home Financials for this Owner
Home Financials are based on the most recent Mortgage that was taken out on this home.
Original Mortgage
$117,000
Outstanding Balance
$19,846
Interest Rate
7.26%
Mortgage Type
Purchase Money Mortgage
Estimated Equity
$490,484
Create a Home Valuation Report for This Property
The Home Valuation Report is an in-depth analysis detailing your home's value as well as a comparison with similar homes in the area
Home Values in the Area
Average Home Value in this Area
Purchase History
| Date | Buyer | Sale Price | Title Company |
|---|---|---|---|
| Turcotte Ronald A | $130,000 | -- |
Source: Public Records
Mortgage History
| Date | Status | Borrower | Loan Amount |
|---|---|---|---|
| Open | Turcotte Ronald A | $25,000 | |
| Open | Turcotte Ronald A | $117,000 | |
| Previous Owner | Turcotte Ronald A | $15,000 | |
| Previous Owner | Turcotte Ronald A | $5,200 |
Source: Public Records
Tax History Compared to Growth
Tax History
| Year | Tax Paid | Tax Assessment Tax Assessment Total Assessment is a certain percentage of the fair market value that is determined by local assessors to be the total taxable value of land and additions on the property. | Land | Improvement |
|---|---|---|---|---|
| 2025 | $5,443 | $440,700 | $142,500 | $298,200 |
| 2024 | $5,208 | $421,700 | $142,500 | $279,200 |
| 2023 | $5,047 | $385,000 | $127,300 | $257,700 |
| 2022 | $4,557 | $341,600 | $122,100 | $219,500 |
| 2021 | $4,386 | $323,200 | $108,100 | $215,100 |
| 2020 | $4,174 | $316,900 | $108,000 | $208,900 |
| 2019 | $3,859 | $295,500 | $101,500 | $194,000 |
| 2018 | $3,786 | $283,600 | $98,700 | $184,900 |
| 2017 | $3,652 | $271,300 | $96,300 | $175,000 |
| 2016 | $3,605 | $268,800 | $96,300 | $172,500 |
| 2015 | $3,509 | $265,200 | $96,300 | $168,900 |
Source: Public Records
Map
Nearby Homes
- 358 Olney St
- 147 Olney St
- 30 Rosemarie Dr
- 72 School St
- 454 Fall River Ave
- 25 Pimental Dr
- 42 Tee Jay Dr
- 679 County St
- 349 County St
- 524 County St
- 5 George St
- 759 Fall River Ave
- 698 Fall River Ave
- 206 Wheeler St
- 420 Chestnut St
- 7 Jill Ct
- 39 John Alden Rd
- 467 Forbes St
- 296 Fall River Ave
- 62 Chestnut St