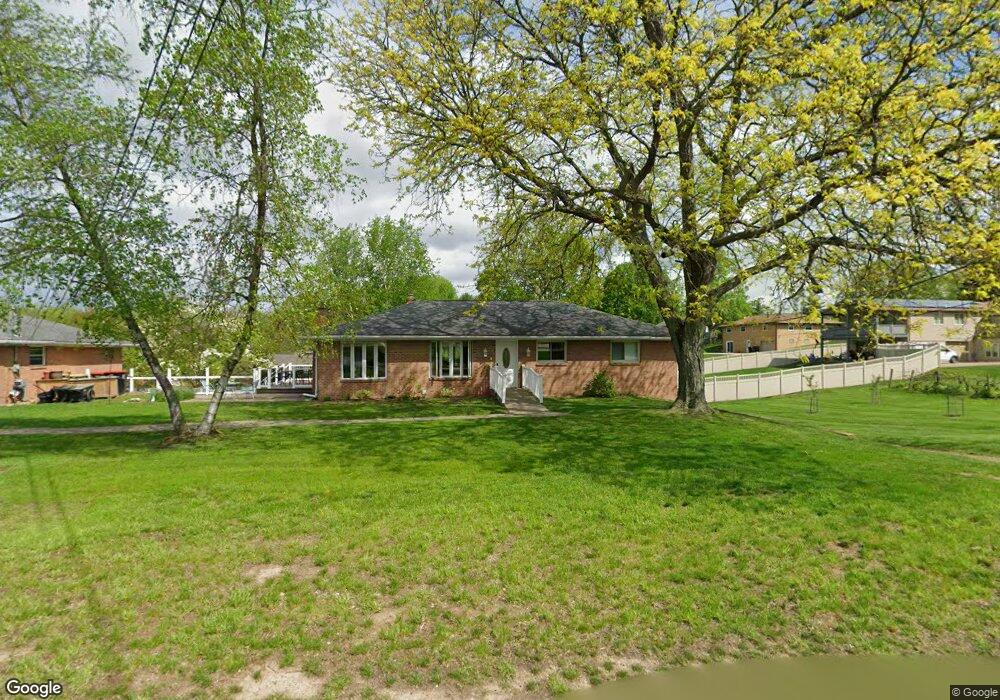
20 Jeff Dr Coraopolis, PA 15108
Estimated Value: $394,428
3
Beds
2
Baths
1,274
Sq Ft
$310/Sq Ft
Est. Value
About This Home
This home is located at 20 Jeff Dr, Coraopolis, PA 15108 and is currently estimated at $394,428, approximately $309 per square foot. 20 Jeff Dr is a home located in Allegheny County with nearby schools including David E. Williams Middle School, Montour Elementary School, and Montour High School.
Ownership History
Date
Name
Owned For
Owner Type
Purchase Details
Closed on
May 30, 2008
Sold by
Litch Annette R
Bought by
Cla Verland
Current Estimated Value
Home Financials for this Owner
Home Financials are based on the most recent Mortgage that was taken out on this home.
Original Mortgage
$146,800
Outstanding Balance
$93,113
Interest Rate
5.91%
Mortgage Type
Commercial
Estimated Equity
$301,315
Purchase Details
Closed on
Aug 19, 1998
Sold by
Hughes Melvyn B and Hughes Janet L
Bought by
Litch Annette R
Purchase Details
Closed on
Oct 25, 1996
Sold by
Hughes Melvyn B and Hughes Janet L
Bought by
Hughes Melvin B and Hughes Janet L
Purchase Details
Closed on
Mar 14, 1995
Sold by
Hughes Melvyn B and Hughes Janet L
Bought by
Creekpoint Ltd Partnership
Purchase Details
Closed on
Jan 1, 1900
Create a Home Valuation Report for This Property
The Home Valuation Report is an in-depth analysis detailing your home's value as well as a comparison with similar homes in the area
Home Values in the Area
Average Home Value in this Area
Purchase History
| Date | Buyer | Sale Price | Title Company |
|---|---|---|---|
| Cla Verland | $183,500 | -- | |
| Litch Annette R | $152,000 | -- | |
| Hughes Melvin B | -- | -- | |
| Creekpoint Ltd Partnership | -- | -- | |
| -- | -- | -- |
Source: Public Records
Mortgage History
| Date | Status | Borrower | Loan Amount |
|---|---|---|---|
| Open | Cla Verland | $146,800 |
Source: Public Records
Tax History
| Year | Tax Paid | Tax Assessment Tax Assessment Total Assessment is a certain percentage of the fair market value that is determined by local assessors to be the total taxable value of land and additions on the property. | Land | Improvement |
|---|---|---|---|---|
| 2025 | $1,125 | $175,000 | $64,000 | $111,000 |
| 2024 | $4,531 | $175,000 | $64,000 | $111,000 |
| 2023 | $4,531 | $175,000 | $64,000 | $111,000 |
| 2022 | $0 | $175,000 | $64,000 | $111,000 |
| 2021 | $4,426 | $175,000 | $64,000 | $111,000 |
| 2020 | $4,426 | $175,000 | $64,000 | $111,000 |
| 2019 | $4,531 | $175,000 | $64,000 | $111,000 |
| 2018 | $0 | $175,000 | $64,000 | $111,000 |
| 2017 | $4,426 | $175,000 | $64,000 | $111,000 |
| 2016 | $545 | $115,275 | $23,000 | $92,275 |
| 2015 | $545 | $115,275 | $23,000 | $92,275 |
| 2014 | $2,793 | $115,275 | $23,000 | $92,275 |
Source: Public Records
Map
Nearby Homes
- 113 Amy jo Ln
- 2204 Wilma Dr
- 142 Olga Ave
- 158 Olga Ave
- 160 Olga Ave
- 2614 Leona Ln Unit A14
- 622 Flynn Dr
- 33 Mason Dr
- 6 Suffolk Dr
- 1894 Oakbine Ave
- 1523 Woodcrest Ave
- Lot 200 Wellesley Ave
- Lot 112 Wellesley Ave
- Lot 202 Wellesley Ave
- Lot 204 Wellesley Ave
- 1900 Beechford Ave
- 221 Felician Dr
- 2120 Pococen Dr
- 68 Herbst Rd
- 113 Hemingway Ln
Your Personal Tour Guide
Ask me questions while you tour the home.