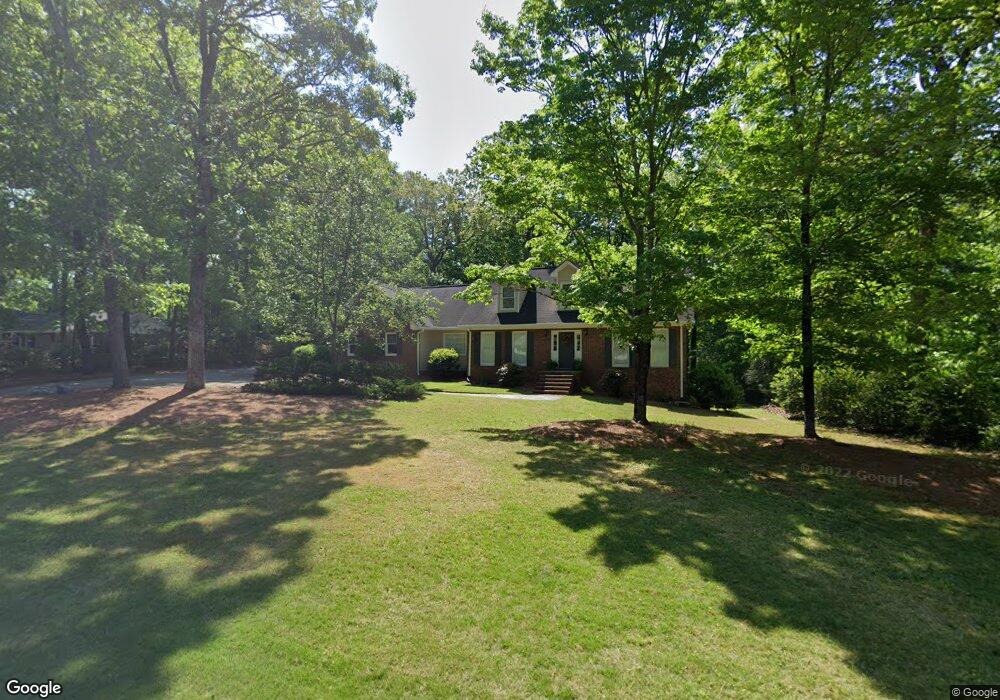
20 John St Winder, GA 30680
Estimated Value: $383,000 - $435,000
3
Beds
3
Baths
2,586
Sq Ft
$159/Sq Ft
Est. Value
About This Home
This home is located at 20 John St, Winder, GA 30680 and is currently estimated at $410,926, approximately $158 per square foot. 20 John St is a home located in Barrow County with nearby schools including Holsenbeck Elementary School, Bear Creek Middle School, and Winder-Barrow High School.
Ownership History
Date
Name
Owned For
Owner Type
Purchase Details
Closed on
Jul 17, 1998
Sold by
Sauls J Charles
Bought by
Albritton Timothy M and Albritton Debbie J
Current Estimated Value
Home Financials for this Owner
Home Financials are based on the most recent Mortgage that was taken out on this home.
Original Mortgage
$123,000
Outstanding Balance
$25,215
Interest Rate
7.02%
Mortgage Type
New Conventional
Estimated Equity
$385,711
Purchase Details
Closed on
Jun 9, 1987
Bought by
Sauls J Charles
Create a Home Valuation Report for This Property
The Home Valuation Report is an in-depth analysis detailing your home's value as well as a comparison with similar homes in the area
Home Values in the Area
Average Home Value in this Area
Purchase History
| Date | Buyer | Sale Price | Title Company |
|---|---|---|---|
| Albritton Timothy M | $175,500 | -- | |
| Sauls J Charles | $15,000 | -- |
Source: Public Records
Mortgage History
| Date | Status | Borrower | Loan Amount |
|---|---|---|---|
| Open | Albritton Timothy M | $123,000 |
Source: Public Records
Tax History Compared to Growth
Tax History
| Year | Tax Paid | Tax Assessment Tax Assessment Total Assessment is a certain percentage of the fair market value that is determined by local assessors to be the total taxable value of land and additions on the property. | Land | Improvement |
|---|---|---|---|---|
| 2024 | $2,830 | $111,422 | $12,000 | $99,422 |
| 2023 | $2,340 | $111,422 | $12,000 | $99,422 |
| 2022 | $2,680 | $84,097 | $12,000 | $72,097 |
| 2021 | $2,769 | $84,097 | $12,000 | $72,097 |
| 2020 | $2,664 | $84,097 | $12,000 | $72,097 |
| 2019 | $2,643 | $81,768 | $12,000 | $69,768 |
| 2018 | $2,630 | $81,768 | $12,000 | $69,768 |
| 2017 | $2,214 | $74,190 | $12,000 | $62,190 |
| 2016 | $2,257 | $71,410 | $12,000 | $59,410 |
| 2015 | $2,260 | $71,410 | $12,000 | $59,410 |
| 2014 | $2,038 | $65,290 | $5,880 | $59,410 |
| 2013 | -- | $60,843 | $5,880 | $54,963 |
Source: Public Records
Map
Nearby Homes
- 5 Olevia St
- 615 Gainesville Hwy
- 82 Cedar Bluff
- 197 Buena Vista St
- 58 Cedar Bluff
- 318 Ryan Rd
- 27 Creekside Dr
- 116 Wisteria Dr
- 303 Rocky Point Ct
- 326 Miles Patrick Rd
- 130 Wisteria Dr
- 66 Wisteria Way
- 69 Wisteria Way
- 52 Wisteria Ct
- 466 Pendergrass Rd
- 311 N Broad St
- 0 Gainesville Hwy Unit 10549985
- 816 Ideal Place
- 746 Baskins Cir