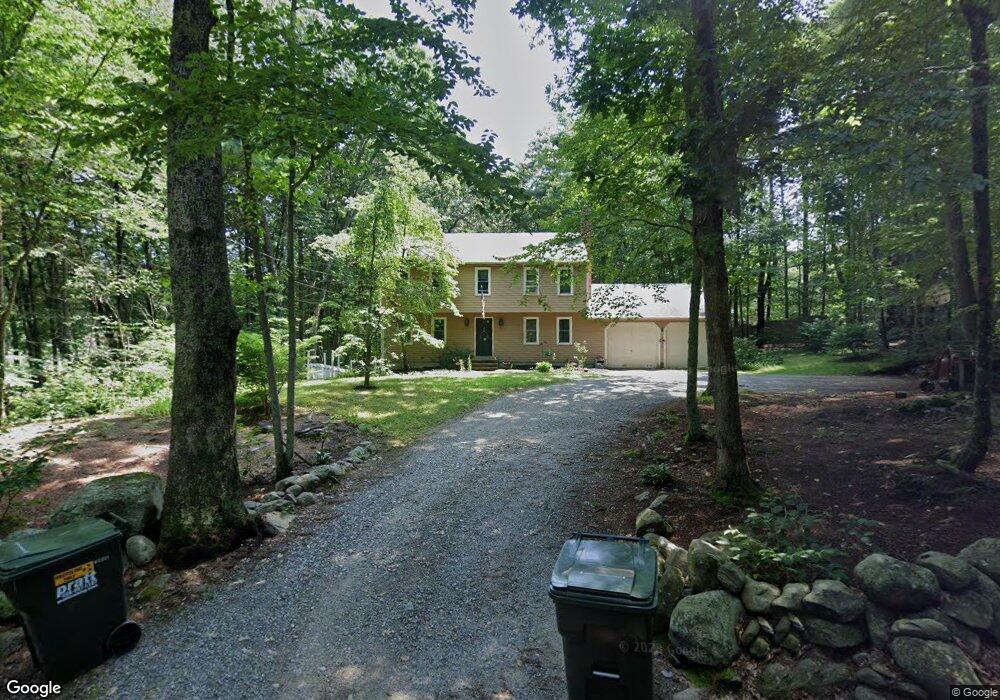
20 Johnson Rd Sutton, MA 01590
Estimated Value: $593,341 - $833,000
4
Beds
3
Baths
1,800
Sq Ft
$373/Sq Ft
Est. Value
About This Home
This home is located at 20 Johnson Rd, Sutton, MA 01590 and is currently estimated at $671,335, approximately $372 per square foot. 20 Johnson Rd is a home located in Worcester County with nearby schools including Sutton Elementary School, Sutton Middle School, and Sutton High School.
Ownership History
Date
Name
Owned For
Owner Type
Purchase Details
Closed on
Apr 14, 2025
Sold by
Terry John P and Jeffers-Terry Mary B
Bought by
P J
Current Estimated Value
Purchase Details
Closed on
Mar 15, 1991
Sold by
Morgano Richard W and Morgano Anastasia
Bought by
Terry John P and Terry Mary B
Create a Home Valuation Report for This Property
The Home Valuation Report is an in-depth analysis detailing your home's value as well as a comparison with similar homes in the area
Home Values in the Area
Average Home Value in this Area
Purchase History
| Date | Buyer | Sale Price | Title Company |
|---|---|---|---|
| P J | -- | None Available | |
| P J | -- | None Available | |
| Terry John P | $187,000 | -- | |
| Terry John P | $187,000 | -- |
Source: Public Records
Mortgage History
| Date | Status | Borrower | Loan Amount |
|---|---|---|---|
| Previous Owner | Terry John P | $276,000 | |
| Previous Owner | Terry John P | $117,000 | |
| Previous Owner | Terry John P | $81,520 |
Source: Public Records
Tax History
| Year | Tax Paid | Tax Assessment Tax Assessment Total Assessment is a certain percentage of the fair market value that is determined by local assessors to be the total taxable value of land and additions on the property. | Land | Improvement |
|---|---|---|---|---|
| 2025 | $6,675 | $555,300 | $183,800 | $371,500 |
| 2024 | $6,509 | $513,300 | $158,400 | $354,900 |
| 2023 | $6,018 | $434,500 | $139,300 | $295,200 |
| 2022 | $6,206 | $408,800 | $140,700 | $268,100 |
| 2021 | $6,115 | $382,200 | $140,700 | $241,500 |
| 2020 | $7,595 | $382,200 | $140,700 | $241,500 |
| 2019 | $5,962 | $360,900 | $140,700 | $220,200 |
| 2018 | $5,751 | $347,500 | $140,700 | $206,800 |
| 2017 | $1,761 | $336,200 | $124,000 | $212,200 |
| 2016 | $5,474 | $328,200 | $124,000 | $204,200 |
| 2015 | $5,296 | $317,500 | $124,000 | $193,500 |
| 2014 | $5,282 | $312,900 | $130,400 | $182,500 |
Source: Public Records
Map
Nearby Homes
- 28 Johnson Rd
- 8 Virginia Ave
- 923 Main St
- 201 Prescott Rd
- 2 D St
- 14 C St
- 578 Carpenter Rd
- 20 Wunschel Dr
- 16 Hough Rd
- 81 Rebecca Rd
- 711 Samuel Dr
- 37 Bayliss Way
- 22 Bayliss Way
- 51 Lincoln Rd
- 86 Kingsnorth St
- 192 Rebecca Rd
- 33 Nautical Way Unit 107
- 36 Compass Point Dr Unit 36
- 32 Edmonds Cir Unit 32
- 128 Linwood Ave
Your Personal Tour Guide
Ask me questions while you tour the home.