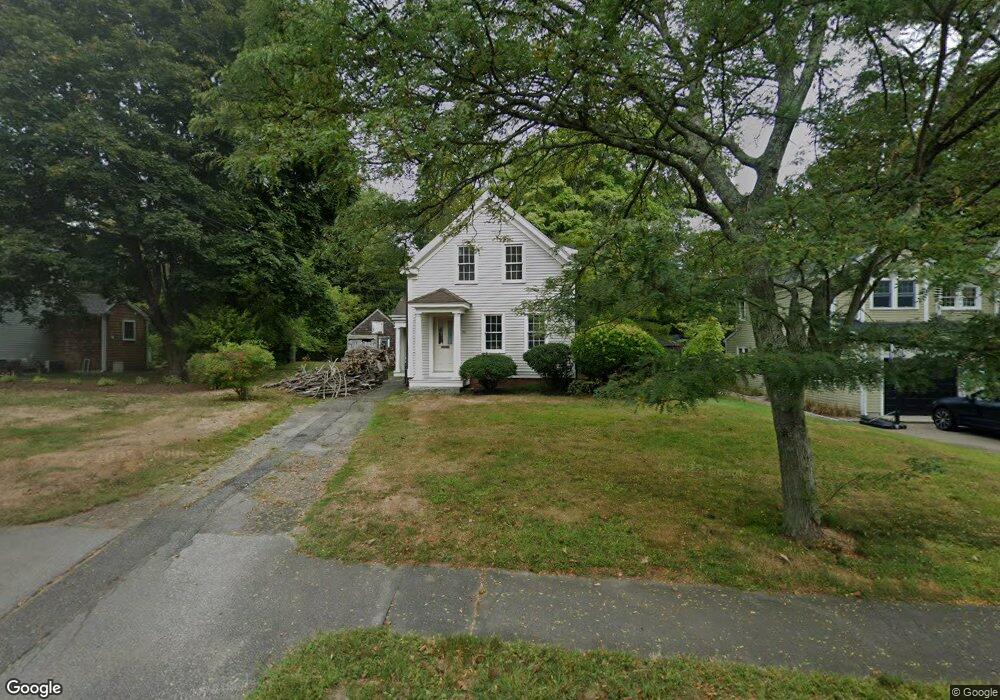
20 Jones St Hingham, MA 02043
Estimated Value: $1,016,000 - $1,386,000
2
Beds
3
Baths
1,973
Sq Ft
$596/Sq Ft
Est. Value
About This Home
This home is located at 20 Jones St, Hingham, MA 02043 and is currently estimated at $1,175,709, approximately $595 per square foot. 20 Jones St is a home located in Plymouth County with nearby schools including East Elementary School, Hingham Middle School, and Hingham High School.
Ownership History
Date
Name
Owned For
Owner Type
Purchase Details
Closed on
Aug 2, 1993
Sold by
Smuts Brooke A
Bought by
Campbell Robert F
Current Estimated Value
Home Financials for this Owner
Home Financials are based on the most recent Mortgage that was taken out on this home.
Original Mortgage
$80,000
Interest Rate
7.32%
Mortgage Type
Purchase Money Mortgage
Purchase Details
Closed on
Jun 28, 1991
Sold by
Ksiazek Michael C and Ksiazek Loretta A
Bought by
Green Brooke A
Home Financials for this Owner
Home Financials are based on the most recent Mortgage that was taken out on this home.
Original Mortgage
$118,000
Interest Rate
9.44%
Mortgage Type
Purchase Money Mortgage
Create a Home Valuation Report for This Property
The Home Valuation Report is an in-depth analysis detailing your home's value as well as a comparison with similar homes in the area
Purchase History
| Date | Buyer | Sale Price | Title Company |
|---|---|---|---|
| Campbell Robert F | $181,000 | -- | |
| Green Brooke A | $186,000 | -- |
Source: Public Records
Mortgage History
| Date | Status | Borrower | Loan Amount |
|---|---|---|---|
| Open | Green Brooke A | $75,000 | |
| Closed | Green Brooke A | $80,000 | |
| Previous Owner | Green Brooke A | $118,000 | |
| Previous Owner | Green Brooke A | $25,000 |
Source: Public Records
Tax History
| Year | Tax Paid | Tax Assessment Tax Assessment Total Assessment is a certain percentage of the fair market value that is determined by local assessors to be the total taxable value of land and additions on the property. | Land | Improvement |
|---|---|---|---|---|
| 2025 | $9,413 | $880,500 | $507,100 | $373,400 |
| 2024 | $8,713 | $803,000 | $507,100 | $295,900 |
| 2023 | $7,888 | $788,800 | $507,100 | $281,700 |
| 2022 | $7,773 | $672,400 | $390,800 | $281,600 |
| 2021 | $8,912 | $638,900 | $390,800 | $248,100 |
| 2020 | $7,367 | $638,900 | $390,800 | $248,100 |
| 2019 | $7,359 | $623,100 | $390,800 | $232,300 |
| 2018 | $7,229 | $614,200 | $390,800 | $223,400 |
| 2017 | $7,327 | $598,100 | $399,500 | $198,600 |
| 2016 | $7,189 | $575,600 | $380,400 | $195,200 |
| 2015 | $6,878 | $548,900 | $362,000 | $186,900 |
Source: Public Records
Map
Nearby Homes
Your Personal Tour Guide
Ask me questions while you tour the home.