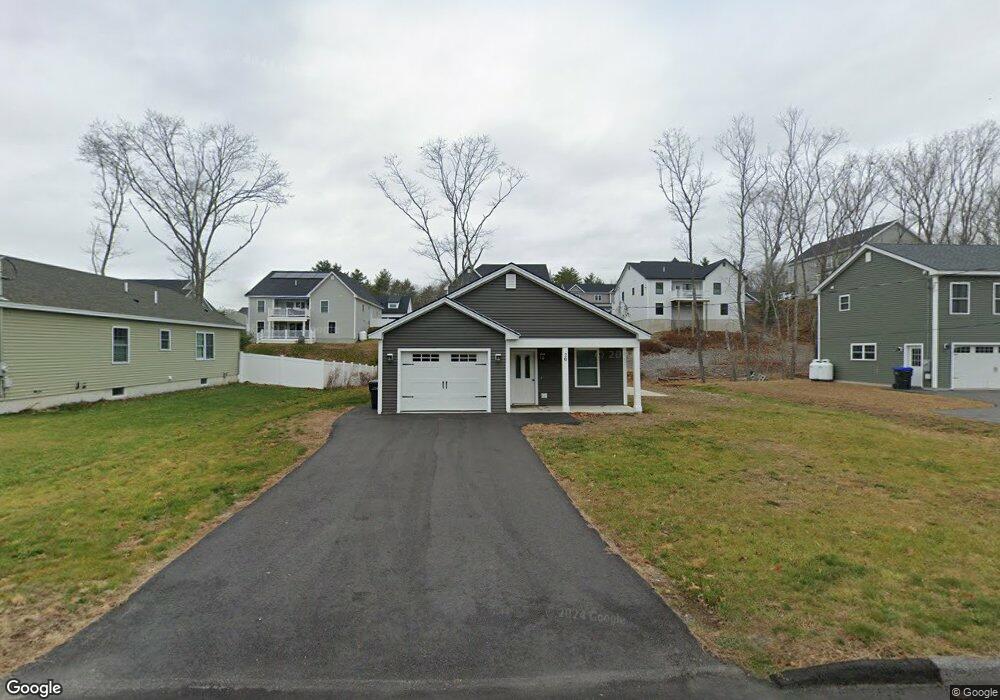
20 Kapok St Old Orchard Beach, ME 04064
Estimated Value: $526,410 - $532,000
3
Beds
2
Baths
1,185
Sq Ft
$447/Sq Ft
Est. Value
About This Home
This home is located at 20 Kapok St, Old Orchard Beach, ME 04064 and is currently estimated at $530,103, approximately $447 per square foot. 20 Kapok St is a home located in York County with nearby schools including Jameson Elementary School, Loranger Memorial School, and Old Orchard Beach High School.
Ownership History
Date
Name
Owned For
Owner Type
Purchase Details
Closed on
Nov 22, 2022
Sold by
Potvin Richard P
Bought by
Spencer Lisa J
Current Estimated Value
Home Financials for this Owner
Home Financials are based on the most recent Mortgage that was taken out on this home.
Original Mortgage
$314,000
Outstanding Balance
$303,872
Interest Rate
7.08%
Mortgage Type
Purchase Money Mortgage
Estimated Equity
$226,231
Purchase Details
Closed on
Jul 7, 2022
Sold by
Hpoob Llc
Bought by
Potvin Richard P
Home Financials for this Owner
Home Financials are based on the most recent Mortgage that was taken out on this home.
Original Mortgage
$250,000
Interest Rate
5.1%
Mortgage Type
Purchase Money Mortgage
Purchase Details
Closed on
May 31, 2016
Sold by
Dodier Stephanie M
Bought by
Ph Developers
Create a Home Valuation Report for This Property
The Home Valuation Report is an in-depth analysis detailing your home's value as well as a comparison with similar homes in the area
Home Values in the Area
Average Home Value in this Area
Purchase History
| Date | Buyer | Sale Price | Title Company |
|---|---|---|---|
| Spencer Lisa J | $414,000 | None Available | |
| Spencer Lisa J | $414,000 | None Available | |
| Spencer Lisa J | $414,000 | None Available | |
| Potvin Richard P | $110,000 | None Available | |
| Potvin Richard P | $110,000 | None Available | |
| Potvin Richard P | $110,000 | None Available | |
| Ph Developers | -- | -- | |
| Ph Developers | -- | -- | |
| Hp & Oob Llc | -- | -- |
Source: Public Records
Mortgage History
| Date | Status | Borrower | Loan Amount |
|---|---|---|---|
| Open | Spencer Lisa J | $314,000 | |
| Closed | Spencer Lisa J | $314,000 | |
| Previous Owner | Potvin Richard P | $250,000 |
Source: Public Records
Tax History Compared to Growth
Tax History
| Year | Tax Paid | Tax Assessment Tax Assessment Total Assessment is a certain percentage of the fair market value that is determined by local assessors to be the total taxable value of land and additions on the property. | Land | Improvement |
|---|---|---|---|---|
| 2024 | $4,895 | $449,900 | $157,300 | $292,600 |
| 2023 | $4,578 | $401,600 | $146,400 | $255,200 |
| 2022 | $1,304 | $106,500 | $106,500 | $0 |
| 2021 | $1,368 | $96,600 | $96,600 | $0 |
| 2020 | $1,095 | $71,000 | $71,000 | $0 |
| 2019 | $1,101 | $71,000 | $71,000 | $0 |
| 2018 | $1,172 | $76,600 | $76,600 | $0 |
| 2017 | $234 | $14,900 | $14,900 | $0 |
| 2016 | $224 | $14,500 | $14,500 | $0 |
| 2015 | $220 | $14,500 | $14,500 | $0 |
| 2014 | $216 | $14,500 | $14,500 | $0 |
| 2013 | $142 | $10,300 | $10,300 | $0 |
Source: Public Records
Map
Nearby Homes
- Lot 3-5 Juniper St
- 25 Juniper St
- 404-3-3 Juniper St
- 36 Dolphin Ave
- 2 Poplar St
- 2 Lindas Way
- 20 Red Oak Dr Unit 2
- 26 Red Oak Dr Unit 5
- 16 Pondview Rd
- 16 Red Oak Dr
- 49 Red Oak Dr
- 21 Red Oak Dr
- 51 Red Oak Dr
- 14 Red Oak Dr
- 13 Red Oak Dr
- 15 Red Oak Dr
- 47 Red Oak Dr
- 12 Red Oak Dr
- 17 Red Oak Dr
- 45 Red Oak Dr