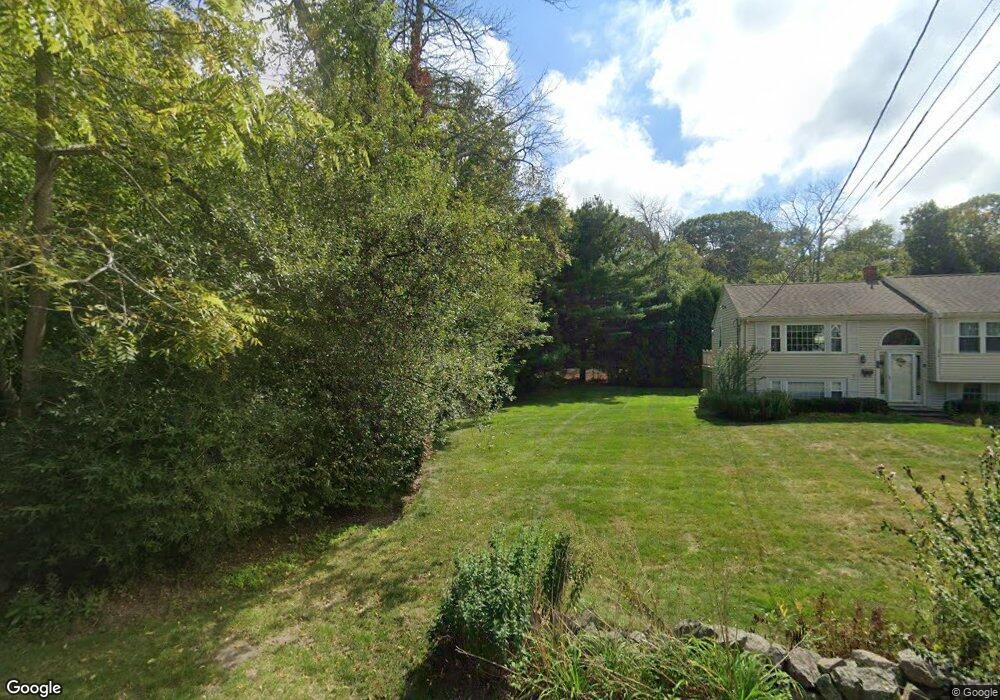
20 King St Cohasset, MA 02025
Estimated Value: $1,424,000 - $1,994,000
3
Beds
3
Baths
4,665
Sq Ft
$352/Sq Ft
Est. Value
About This Home
This home is located at 20 King St, Cohasset, MA 02025 and is currently estimated at $1,643,353, approximately $352 per square foot. 20 King St is a home located in Norfolk County with nearby schools including Joseph Osgood School, Deer Hill School, and Cohasset Middle School.
Ownership History
Date
Name
Owned For
Owner Type
Purchase Details
Closed on
Apr 11, 2025
Sold by
Robbins Wayne H
Bought by
Wayne H Robbins Jr T H and Wayne Robbins
Current Estimated Value
Purchase Details
Closed on
Aug 27, 2003
Sold by
Est Johansen Pamela M and Hawkes Melinda
Bought by
Robbins Wayne H and Robbins Pamela J
Create a Home Valuation Report for This Property
The Home Valuation Report is an in-depth analysis detailing your home's value as well as a comparison with similar homes in the area
Home Values in the Area
Average Home Value in this Area
Purchase History
| Date | Buyer | Sale Price | Title Company |
|---|---|---|---|
| Wayne H Robbins Jr T H | -- | None Available | |
| Wayne H Robbins Jr T H | -- | None Available | |
| Robbins Wayne H | $400,000 | -- | |
| Robbins Wayne H | $400,000 | -- |
Source: Public Records
Mortgage History
| Date | Status | Borrower | Loan Amount |
|---|---|---|---|
| Previous Owner | Robbins Wayne H | $417,000 | |
| Previous Owner | Robbins Wayne H | $65,000 |
Source: Public Records
Tax History
| Year | Tax Paid | Tax Assessment Tax Assessment Total Assessment is a certain percentage of the fair market value that is determined by local assessors to be the total taxable value of land and additions on the property. | Land | Improvement |
|---|---|---|---|---|
| 2025 | $12,825 | $1,107,500 | $267,400 | $840,100 |
| 2024 | $13,912 | $1,143,100 | $254,000 | $889,100 |
| 2023 | $13,008 | $1,102,400 | $253,800 | $848,600 |
| 2022 | $12,635 | $1,006,000 | $225,100 | $780,900 |
| 2021 | $12,419 | $952,400 | $225,100 | $727,300 |
| 2020 | $12,353 | $952,400 | $225,100 | $727,300 |
| 2019 | $12,286 | $952,400 | $225,100 | $727,300 |
| 2018 | $12,181 | $952,400 | $225,100 | $727,300 |
| 2017 | $12,293 | $941,300 | $214,400 | $726,900 |
| 2016 | $12,114 | $940,500 | $213,600 | $726,900 |
| 2015 | $11,954 | $940,500 | $213,600 | $726,900 |
| 2014 | $11,684 | $931,700 | $204,800 | $726,900 |
Source: Public Records
Map
Nearby Homes
- 137 Fairoaks Ln
- 14 Cedarledge Village
- 506-512 N Main St
- 96 Forest Ave
- 130 Forest Ave
- 175 Sohier St
- 31 Chittenden Ln Unit 31
- 50 Jerusalem Rd
- 12 Tupelo Rd
- 114 Hull St
- 46 Pond St
- 166 Hull St
- 101 Pond St
- 30 Diab Ln Unit 8
- 3 Brook St Unit A
- 560 Jerusalem Rd
- 597 Jerusalem Rd
- 40 Pond St
- 128 Elm St Unit 211
- 128 Elm St Unit 210
Your Personal Tour Guide
Ask me questions while you tour the home.