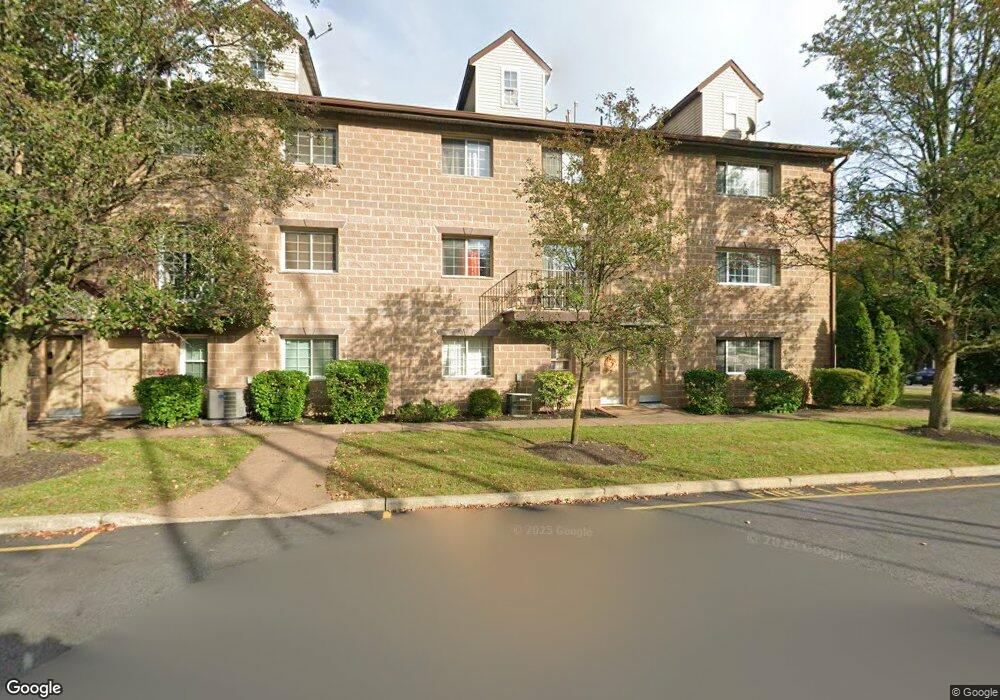
20 Klint Ct Unit 20 Nanuet, NY 10954
Estimated Value: $376,000 - $404,601
2
Beds
2
Baths
1,192
Sq Ft
$328/Sq Ft
Est. Value
About This Home
This home is located at 20 Klint Ct Unit 20, Nanuet, NY 10954 and is currently estimated at $391,400, approximately $328 per square foot. 20 Klint Ct Unit 20 is a home located in Rockland County with nearby schools including Fleetwood Elementary School, Chestnut Ridge Middle School, and Spring Valley High School.
Ownership History
Date
Name
Owned For
Owner Type
Purchase Details
Closed on
Dec 3, 2015
Sold by
Gallarde Ernesto E
Bought by
Lisondra Sheryl Mae G
Current Estimated Value
Purchase Details
Closed on
Mar 14, 2002
Sold by
Garewal Karan
Bought by
Gallarde Ernesto E and Gallarde Cecilia G
Home Financials for this Owner
Home Financials are based on the most recent Mortgage that was taken out on this home.
Original Mortgage
$152,010
Interest Rate
6.91%
Mortgage Type
Purchase Money Mortgage
Purchase Details
Closed on
Oct 20, 1999
Sold by
Conklin Park Inc
Bought by
Pedrozo Emilia V
Home Financials for this Owner
Home Financials are based on the most recent Mortgage that was taken out on this home.
Original Mortgage
$99,600
Interest Rate
7.83%
Mortgage Type
Purchase Money Mortgage
Create a Home Valuation Report for This Property
The Home Valuation Report is an in-depth analysis detailing your home's value as well as a comparison with similar homes in the area
Home Values in the Area
Average Home Value in this Area
Purchase History
| Date | Buyer | Sale Price | Title Company |
|---|---|---|---|
| Lisondra Sheryl Mae G | $177,000 | Teresa Kenny | |
| Lisondra Sheryl Mae G | $177,000 | Teresa Kenny | |
| Gallarde Ernesto E | $168,900 | Ticor Title Insurance | |
| Gallarde Ernesto E | $168,900 | Ticor Title Insurance | |
| Gallarde Ernesto E | $168,900 | Ticor Title Insurance | |
| Pedrozo Emilia V | $124,500 | -- | |
| Pedrozo Emilia V | $124,500 | -- | |
| Pedrozo Emilia V | $124,500 | -- |
Source: Public Records
Mortgage History
| Date | Status | Borrower | Loan Amount |
|---|---|---|---|
| Previous Owner | Gallarde Ernesto E | $152,010 | |
| Previous Owner | Pedrozo Emilia V | $99,600 |
Source: Public Records
Tax History Compared to Growth
Tax History
| Year | Tax Paid | Tax Assessment Tax Assessment Total Assessment is a certain percentage of the fair market value that is determined by local assessors to be the total taxable value of land and additions on the property. | Land | Improvement |
|---|---|---|---|---|
| 2024 | $12,800 | $71,900 | $8,100 | $63,800 |
| 2023 | $12,800 | $71,900 | $8,100 | $63,800 |
| 2022 | $5,974 | $71,900 | $8,100 | $63,800 |
| 2021 | $5,974 | $71,900 | $8,100 | $63,800 |
| 2020 | $5,145 | $71,900 | $8,100 | $63,800 |
| 2019 | $5,053 | $71,900 | $8,100 | $63,800 |
| 2018 | $5,053 | $71,900 | $8,100 | $63,800 |
| 2017 | $5,056 | $71,900 | $8,100 | $63,800 |
| 2016 | $5,241 | $71,900 | $8,100 | $63,800 |
| 2015 | -- | $71,900 | $8,100 | $63,800 |
| 2014 | -- | $71,900 | $8,100 | $63,800 |
Source: Public Records
Map
Nearby Homes
- 63 Omni Parc Dr
- 14 Omni Parc Dr
- 12 Omni Parc Dr
- 600 Tudor Hill Unit 600
- 76 Division Ave
- 60 S Central Ave
- 66 Gerow Ave
- 12-14 Lincoln St
- 80 New Holland Village Unit 80
- 3 Valley Dr
- 43 Division Ave
- 89 New Holland Village Unit 89
- 31-37 Scotland Hill Rd
- 19 Birchwood Ave
- 17 Division Ave
- 119 S Main St Unit B
- 18 W Funston Ave Unit 211
- 29 Memorial Park Dr
- 79 S Madison Ave Unit 201
- 79 S Madison Ave Unit 213
- 21 Klint Ct
- 19 Klint Ct Unit 19
- 23 Klint Ct Unit 23
- 24 Klint Ct Unit 24
- 25 Klint Ct Unit 25
- 26 Klint Ct
- 22 Klint Ct
- 27 Klint Ct Unit 27
- 18 Klint Ct Unit 18
- 28 Klint Ct Unit 28
- 29 Klint Ct
- 17 Klint Ct Unit 17
- 30 Klint Ct Unit 30
- 7 Klint Ct Unit 7
- 8 Klint Ct Unit 8
- 9 Klint Ct Unit 9
- 6 Klint Ct Unit 6
- 5 Klint Ct Unit 5
- 10 Klint Ct Unit 10
- 4 Klint Ct Unit 4