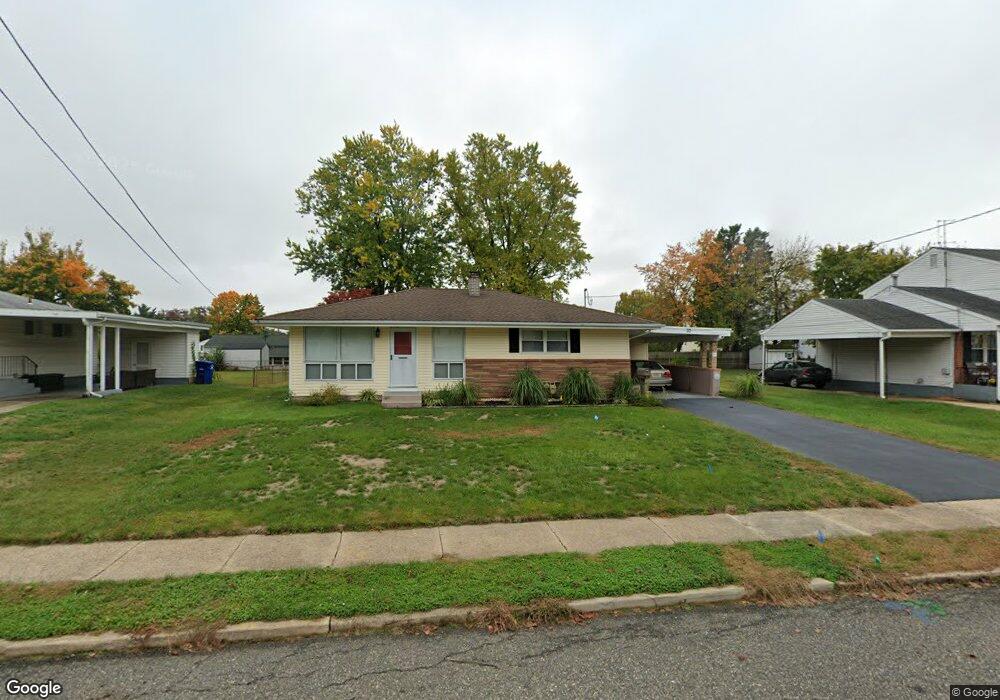
20 Langdon Rd Burlington, NJ 08016
Estimated Value: $252,000 - $329,000
--
Bed
--
Bath
1,120
Sq Ft
$257/Sq Ft
Est. Value
About This Home
This home is located at 20 Langdon Rd, Burlington, NJ 08016 and is currently estimated at $287,976, approximately $257 per square foot. 20 Langdon Rd is a home located in Burlington County with nearby schools including B Bernice Young Elementary School, Fountain Woods Elementary School, and Burlington Township Middle School at Springside.
Ownership History
Date
Name
Owned For
Owner Type
Purchase Details
Closed on
Nov 15, 2022
Sold by
Grant Ernest C
Bought by
Anderson Joi Nicole
Current Estimated Value
Home Financials for this Owner
Home Financials are based on the most recent Mortgage that was taken out on this home.
Original Mortgage
$150,000
Outstanding Balance
$145,349
Interest Rate
6.95%
Mortgage Type
Balloon
Estimated Equity
$142,627
Purchase Details
Closed on
Oct 22, 2009
Sold by
Grant Ernest C and Jeffries Grant Mae
Bought by
Grant Ernest C
Create a Home Valuation Report for This Property
The Home Valuation Report is an in-depth analysis detailing your home's value as well as a comparison with similar homes in the area
Home Values in the Area
Average Home Value in this Area
Purchase History
| Date | Buyer | Sale Price | Title Company |
|---|---|---|---|
| Anderson Joi Nicole | $200,000 | Surety Title | |
| Grant Ernest C | -- | None Available |
Source: Public Records
Mortgage History
| Date | Status | Borrower | Loan Amount |
|---|---|---|---|
| Open | Anderson Joi Nicole | $150,000 |
Source: Public Records
Tax History Compared to Growth
Tax History
| Year | Tax Paid | Tax Assessment Tax Assessment Total Assessment is a certain percentage of the fair market value that is determined by local assessors to be the total taxable value of land and additions on the property. | Land | Improvement |
|---|---|---|---|---|
| 2025 | $3,881 | $128,000 | $39,900 | $88,100 |
| 2024 | $3,823 | $128,000 | $39,900 | $88,100 |
| 2023 | $3,823 | $128,000 | $39,900 | $88,100 |
| 2022 | $3,807 | $128,000 | $39,900 | $88,100 |
| 2021 | $3,844 | $128,000 | $39,900 | $88,100 |
| 2020 | $3,836 | $128,000 | $39,900 | $88,100 |
| 2019 | $3,845 | $128,000 | $39,900 | $88,100 |
| 2018 | $3,788 | $128,000 | $39,900 | $88,100 |
| 2017 | $3,764 | $128,000 | $39,900 | $88,100 |
| 2016 | $4,809 | $160,300 | $43,200 | $117,100 |
| 2015 | $4,726 | $160,300 | $43,200 | $117,100 |
| 2014 | $4,553 | $160,300 | $43,200 | $117,100 |
Source: Public Records
Map
Nearby Homes