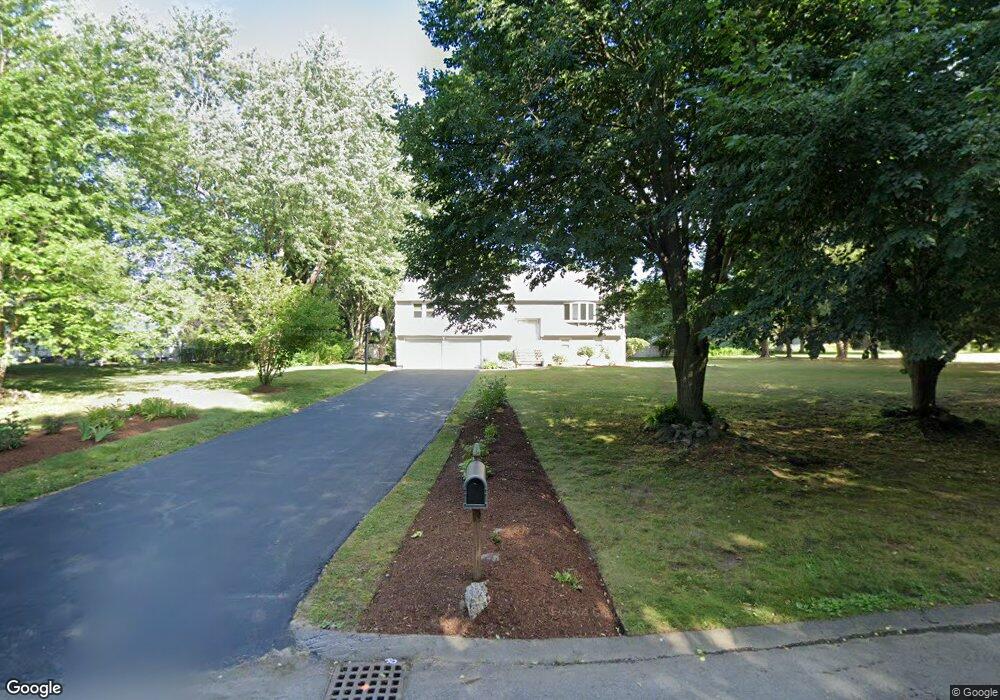
20 Langdon Rd Wayland, MA 01778
Estimated Value: $1,081,000 - $1,304,000
4
Beds
4
Baths
2,532
Sq Ft
$465/Sq Ft
Est. Value
About This Home
This home is located at 20 Langdon Rd, Wayland, MA 01778 and is currently estimated at $1,176,240, approximately $464 per square foot. 20 Langdon Rd is a home located in Middlesex County with nearby schools including Wayland High School, Veritas Christian Academy, and The Rivers School.
Ownership History
Date
Name
Owned For
Owner Type
Purchase Details
Closed on
Oct 30, 2017
Sold by
Kannabiran Rengan and Kannabiran Padmavathi
Bought by
Kannabiran Vishnu and Kannabiran Suma
Current Estimated Value
Home Financials for this Owner
Home Financials are based on the most recent Mortgage that was taken out on this home.
Original Mortgage
$680,000
Outstanding Balance
$568,750
Interest Rate
3.78%
Mortgage Type
Purchase Money Mortgage
Estimated Equity
$607,490
Create a Home Valuation Report for This Property
The Home Valuation Report is an in-depth analysis detailing your home's value as well as a comparison with similar homes in the area
Home Values in the Area
Average Home Value in this Area
Purchase History
| Date | Buyer | Sale Price | Title Company |
|---|---|---|---|
| Kannabiran Vishnu | $850,000 | -- | |
| Kannabiran Vishnu | $850,000 | -- |
Source: Public Records
Mortgage History
| Date | Status | Borrower | Loan Amount |
|---|---|---|---|
| Open | Kannabiran Vishnu | $680,000 | |
| Closed | Kannabiran Vishnu | $680,000 | |
| Previous Owner | Kannabiran Vishnu | $330,000 |
Source: Public Records
Tax History Compared to Growth
Tax History
| Year | Tax Paid | Tax Assessment Tax Assessment Total Assessment is a certain percentage of the fair market value that is determined by local assessors to be the total taxable value of land and additions on the property. | Land | Improvement |
|---|---|---|---|---|
| 2025 | $15,868 | $1,015,200 | $518,900 | $496,300 |
| 2024 | $15,374 | $990,600 | $494,300 | $496,300 |
| 2023 | $14,887 | $894,100 | $449,400 | $444,700 |
| 2022 | $14,245 | $776,300 | $372,300 | $404,000 |
| 2021 | $13,649 | $737,000 | $338,400 | $398,600 |
| 2020 | $13,185 | $742,400 | $338,400 | $404,000 |
| 2019 | $12,513 | $684,500 | $322,400 | $362,100 |
| 2018 | $0 | $639,600 | $322,400 | $317,200 |
| 2017 | $11,120 | $613,000 | $306,900 | $306,100 |
| 2016 | $10,766 | $620,900 | $301,000 | $319,900 |
Source: Public Records
Map
Nearby Homes