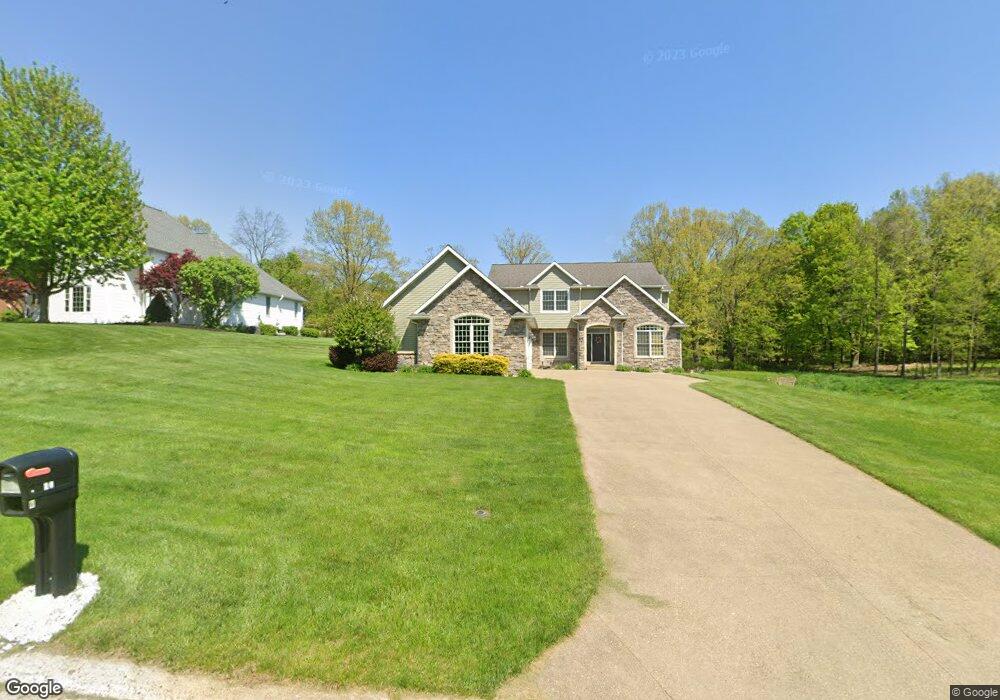
20 Laurelwood Dr Unit Lot 9 Mount Vernon, OH 43050
Estimated Value: $476,000 - $632,000
4
Beds
4
Baths
2,344
Sq Ft
$247/Sq Ft
Est. Value
About This Home
This home is located at 20 Laurelwood Dr Unit Lot 9, Mount Vernon, OH 43050 and is currently estimated at $578,173, approximately $246 per square foot. 20 Laurelwood Dr Unit Lot 9 is a home located in Knox County with nearby schools including Mount Vernon High School, St. Vincent de Paul School, and Christian Star Academy.
Ownership History
Date
Name
Owned For
Owner Type
Purchase Details
Closed on
May 29, 2018
Bought by
Grandstaff Jeffrey A
Current Estimated Value
Home Financials for this Owner
Home Financials are based on the most recent Mortgage that was taken out on this home.
Original Mortgage
$360,000
Outstanding Balance
$312,451
Interest Rate
4.66%
Estimated Equity
$265,722
Purchase Details
Closed on
May 18, 2009
Sold by
Grandstaff Raymond O and Grandstaff Nellie M
Bought by
Grandstaff Jeffrey and Grandstaff Leslie
Purchase Details
Closed on
Aug 27, 2008
Sold by
Ohio General Partnership
Bought by
Zodiac Properties Inc and Grandstaff Raymond O
Purchase Details
Closed on
Aug 26, 2008
Sold by
Zodiac Properties Inc
Bought by
Grandstaff Raymond O
Purchase Details
Closed on
Sep 27, 1995
Bought by
Z And B Trustees Inc An O
Purchase Details
Closed on
Sep 19, 1995
Bought by
Pennel Properties An Ohio
Create a Home Valuation Report for This Property
The Home Valuation Report is an in-depth analysis detailing your home's value as well as a comparison with similar homes in the area
Home Values in the Area
Average Home Value in this Area
Purchase History
| Date | Buyer | Sale Price | Title Company |
|---|---|---|---|
| Grandstaff Jeffrey A | -- | -- | |
| Grandstaff Jeffrey | -- | None Available | |
| Zodiac Properties Inc | -- | None Available | |
| Grandstaff Raymond O | $9,375 | None Available | |
| Z And B Trustees Inc An O | -- | -- | |
| Pennel Properties An Ohio | -- | -- |
Source: Public Records
Mortgage History
| Date | Status | Borrower | Loan Amount |
|---|---|---|---|
| Open | Grandstaff Jeffrey A | $360,000 | |
| Closed | Grandstaff Jeffrey A | -- |
Source: Public Records
Tax History Compared to Growth
Tax History
| Year | Tax Paid | Tax Assessment Tax Assessment Total Assessment is a certain percentage of the fair market value that is determined by local assessors to be the total taxable value of land and additions on the property. | Land | Improvement |
|---|---|---|---|---|
| 2024 | $6,487 | $168,120 | $22,930 | $145,190 |
| 2023 | $6,487 | $168,120 | $22,930 | $145,190 |
| 2022 | $4,936 | $121,830 | $16,620 | $105,210 |
| 2021 | $4,936 | $116,670 | $16,620 | $100,050 |
| 2020 | $4,808 | $116,670 | $16,620 | $100,050 |
| 2019 | $4,907 | $110,980 | $15,500 | $95,480 |
| 2018 | $4,907 | $110,980 | $15,500 | $95,480 |
| 2017 | $4,819 | $110,980 | $15,500 | $95,480 |
| 2016 | $4,469 | $102,750 | $14,350 | $88,400 |
| 2015 | $4,488 | $102,750 | $14,350 | $88,400 |
| 2014 | $4,511 | $102,750 | $14,350 | $88,400 |
| 2013 | $4,380 | $95,170 | $12,150 | $83,020 |
Source: Public Records
Map
Nearby Homes
- 17375 Gambier Rd
- 9243 Kline Ln
- 1575 New Gambier Rd
- 17980 Gambier Rd
- 4 Craig Dr
- 84 Woodlake Trail
- 60 Wildwood Ln
- 0 Wildwood Ln
- 42 Wildwood Ln
- 55 Wildwood Ln
- 2 Coventry Ct W
- 2 Coventry Ct
- 1109 Oak Street Extension
- 1107 Oak Street Extension
- 301 Teryl Dr
- 900 E Gambier St
- 200 Eastwood Dr
- 0 Venture Dr Unit 20240369
- 812 Howard St
- 20 Laurelwood Dr
- 18 Laurelwood Dr
- 16 Laurelwood Dr
- 21 Laurelwood Dr
- 17 Laurelwood Dr
- 14 Laurelwood Dr
- 15 Laurelwood Dr
- 1439 Laurel Valley Dr
- 1446 Laurel Valley Dr
- 1451 Laurel Valley Dr
- 1442 Laurel Valley Dr
- 12 Laurelwood Dr
- 13 Laurelwood Dr
- 22 Laurel Valley Dr
- 10 Laurel Valley Dr
- 23 Laurel Valley Dr
- 11 Laurel Valley Dr
- 21 Laurel Valley Dr
- 0 Laurel Valley Dr Unit Lot 11 2827524
- 0 Laurel Valley Dr