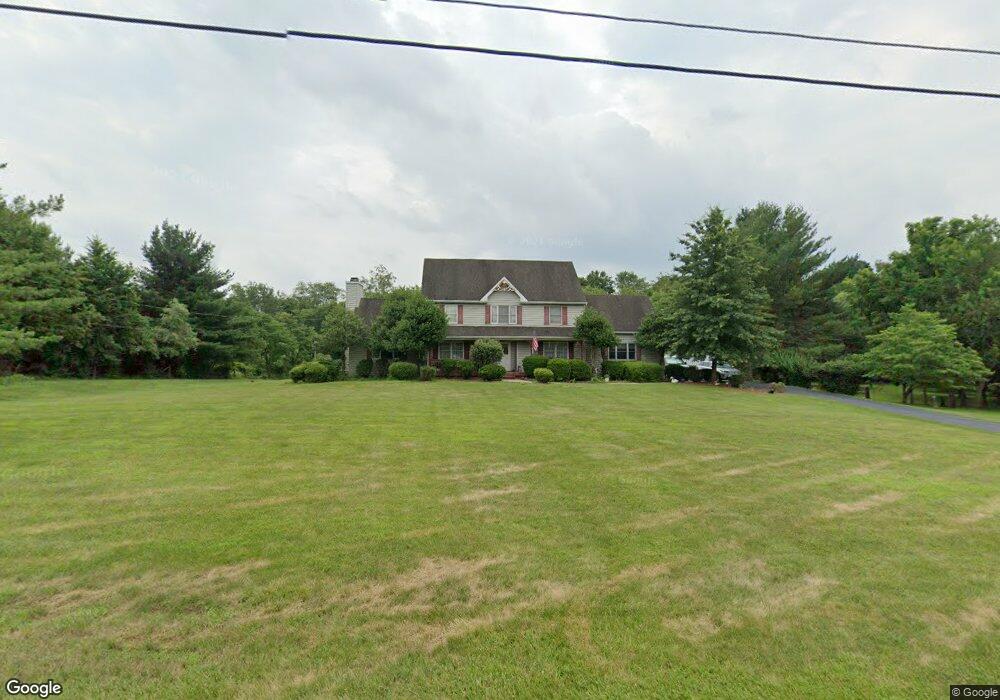
20 Lehigh Rd Branchburg, NJ 08853
Branchburg Township NeighborhoodEstimated Value: $861,000 - $933,000
--
Bed
--
Bath
2,882
Sq Ft
$309/Sq Ft
Est. Value
About This Home
This home is located at 20 Lehigh Rd, Branchburg, NJ 08853 and is currently estimated at $891,595, approximately $309 per square foot. 20 Lehigh Rd is a home located in Somerset County with nearby schools including Whiton Elementary School, Stony Brook School, and Branchburg Central Middle School.
Ownership History
Date
Name
Owned For
Owner Type
Purchase Details
Closed on
Dec 20, 1993
Sold by
C I C Const Inc
Bought by
Klein Joseph
Current Estimated Value
Home Financials for this Owner
Home Financials are based on the most recent Mortgage that was taken out on this home.
Original Mortgage
$186,000
Interest Rate
7.03%
Purchase Details
Closed on
Jun 30, 1992
Sold by
Statewide Savings Bank S L A
Bought by
Cardamone James J
Purchase Details
Closed on
Mar 13, 1991
Sold by
Lundrobert H Sheriff Somerset Cty
Bought by
Statewide Savings Bank S L A
Create a Home Valuation Report for This Property
The Home Valuation Report is an in-depth analysis detailing your home's value as well as a comparison with similar homes in the area
Home Values in the Area
Average Home Value in this Area
Purchase History
| Date | Buyer | Sale Price | Title Company |
|---|---|---|---|
| Klein Joseph | $286,900 | -- | |
| Cardamone James J | $56,500 | -- | |
| Statewide Savings Bank S L A | $10,200 | -- |
Source: Public Records
Mortgage History
| Date | Status | Borrower | Loan Amount |
|---|---|---|---|
| Closed | Klein Joseph | $186,000 |
Source: Public Records
Tax History Compared to Growth
Tax History
| Year | Tax Paid | Tax Assessment Tax Assessment Total Assessment is a certain percentage of the fair market value that is determined by local assessors to be the total taxable value of land and additions on the property. | Land | Improvement |
|---|---|---|---|---|
| 2025 | $11,879 | $734,300 | $185,600 | $548,700 |
| 2024 | $11,879 | $658,500 | $185,600 | $472,900 |
| 2023 | $11,610 | $620,500 | $185,600 | $434,900 |
| 2022 | $11,745 | $596,500 | $185,600 | $410,900 |
| 2021 | $11,955 | $565,500 | $185,600 | $379,900 |
| 2020 | $11,789 | $550,100 | $185,600 | $364,500 |
| 2019 | $11,706 | $543,200 | $185,600 | $357,600 |
| 2018 | $11,535 | $533,800 | $175,600 | $358,200 |
| 2017 | $11,563 | $531,400 | $168,600 | $362,800 |
| 2016 | $11,519 | $526,000 | $158,600 | $367,400 |
| 2015 | $11,579 | $529,700 | $153,600 | $376,100 |
| 2014 | $11,720 | $542,600 | $153,600 | $389,000 |
Source: Public Records
Map
Nearby Homes