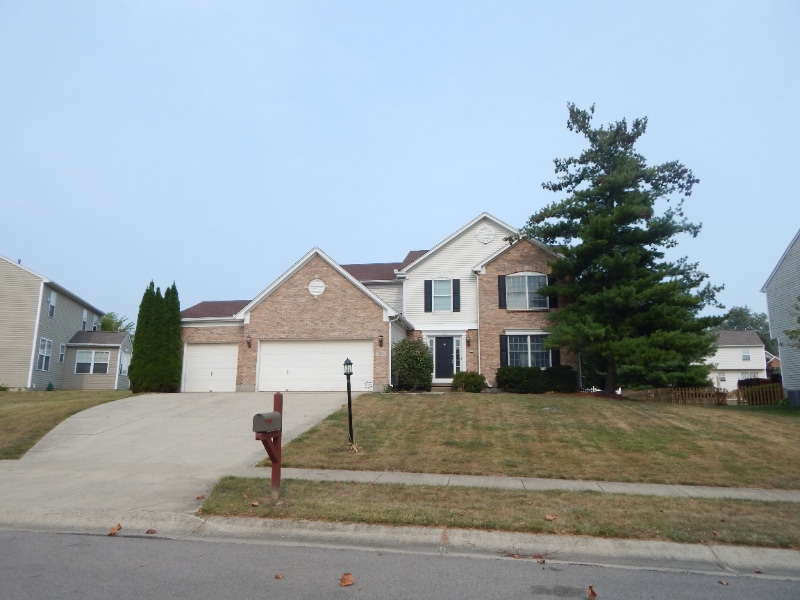
20 Lexington Ct Springboro, OH 45066
Clearcreek Township Neighborhood
4
Beds
4.5
Baths
2,910
Sq Ft
0.26
Acres
About This Home
Property Id: 2240239
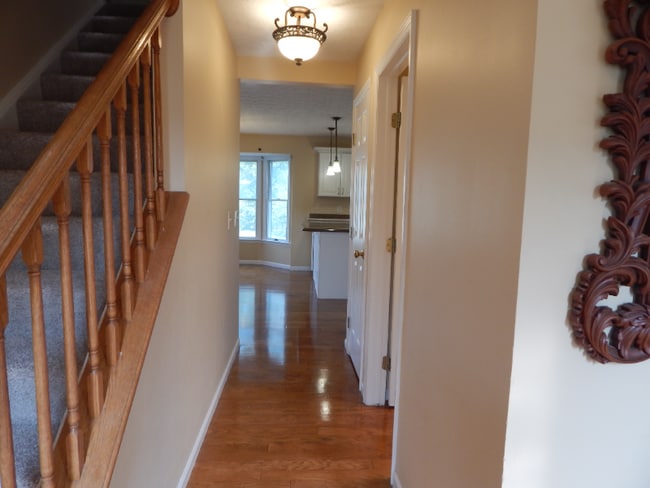
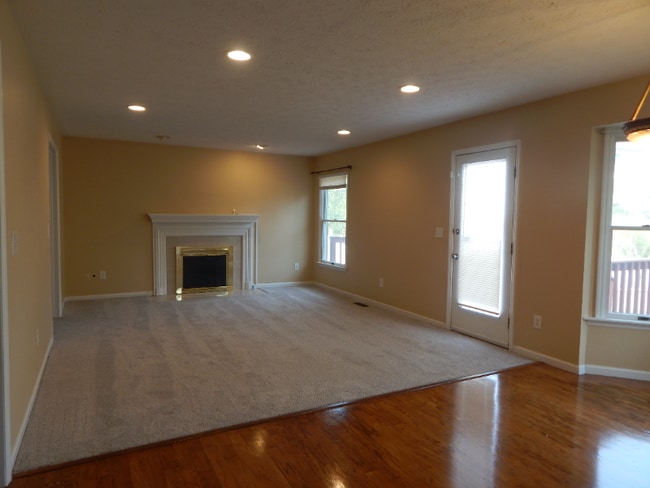
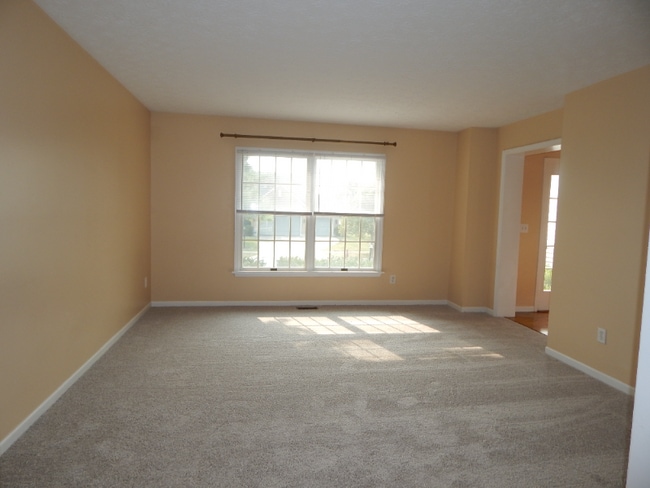
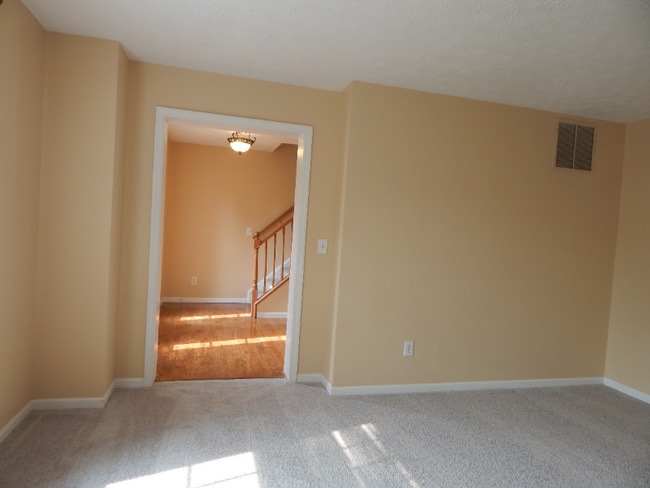
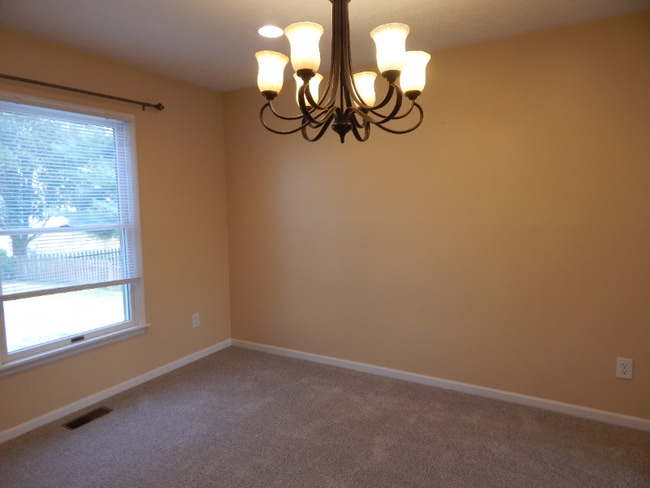
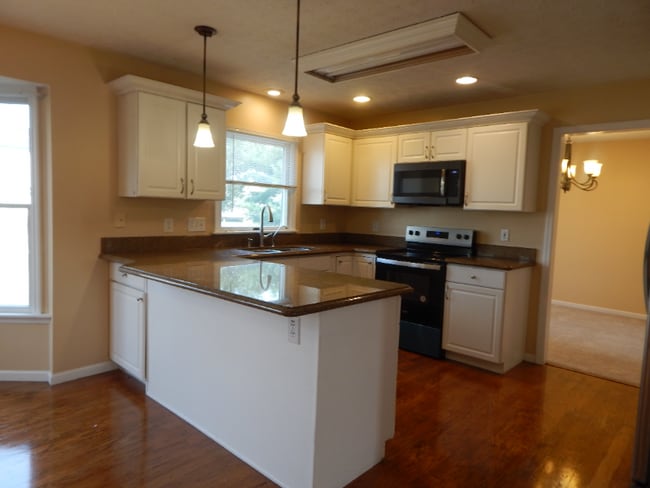
Beautiful home located in the Reserves of Brookside 2 .This large home features 4 bedrooms, (dual primary bedrooms on second floor) 4 full baths and 1 half bath. The first floor features a study off the family room, the family room is open to the kitchen and eating area. There is a formal dining room and living room. The basement is finished and has a finished room with full bath. 3 car garage. Kitchen features granite countertops. Home is available for immediate occupancy. No smoking.
Listing Provided By

Map
Property History
| Date | Event | Price | List to Sale | Price per Sq Ft |
|---|---|---|---|---|
| 11/19/2025 11/19/25 | For Rent | $2,700 | -- | -- |
Nearby Homes
- 60 Brighton Ct
- 1264 Normandy Rue
- 640 Springmill Dr
- 320 Springmill Dr
- 9354 Remington Hill Rd
- 9229 Bennington Way
- 9378 Remington Hill Rd
- 9279 Maxwells Crossing
- 25 Sandelwood St
- 9195 Glenridge Blvd
- 351 Christopher Dr
- 8455 London Ct
- 8301 Red Lion 5 Points Rd
- 65 Artesian Ct
- 412 Belleclaire Hill
- 270 Sycamore Springs Dr
- 639 Birchcreek Way
- 88 N Glen Oak Dr
- 1557 Ashbury Woods Dr
- 7498 Majestic Trail
- 37 W Lytle 5 Points Rd
- 10 Aime Dr
- 10 Falls Blvd
- 80 Gregg Ct
- 1198 W Social Row Rd
- 1435 Redsunset Dr
- 1515 N Wood Creek Dr
- 45 Haverstraw Place
- 9414 Aspen Brook Ct
- 318 E Central Ave
- 17 Hawthorne Gate Dr
- 1664 N Wood Creek Dr
- 10080 Edgerton Dr
- 9798 Sheehan Rd
- 475 Gilpin Dr
- 140 Redbud Dr
- 2895 Taos Dr
- 9475 Copperton Dr
- 2031 Beth Ann Way
- 9634 Sagemeadow Ct