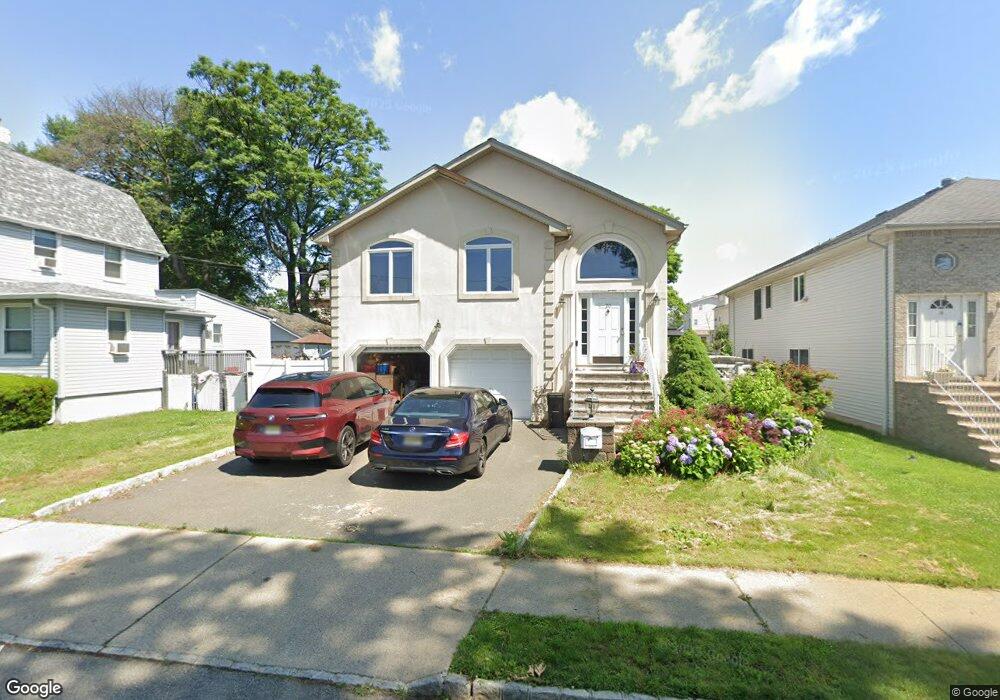
20 Locust Ave Dumont, NJ 07628
Estimated Value: $753,000 - $928,000
--
Bed
--
Bath
2,504
Sq Ft
$331/Sq Ft
Est. Value
About This Home
This home is located at 20 Locust Ave, Dumont, NJ 07628 and is currently estimated at $828,605, approximately $330 per square foot. 20 Locust Ave is a home located in Bergen County with nearby schools including Dumont High School and Institute For Educational Achievement.
Ownership History
Date
Name
Owned For
Owner Type
Purchase Details
Closed on
Apr 28, 2015
Sold by
Fried Susan A and Rivera Marcos
Bought by
Roy Deepanjan and Ghosh Himagna
Current Estimated Value
Home Financials for this Owner
Home Financials are based on the most recent Mortgage that was taken out on this home.
Original Mortgage
$466,396
Outstanding Balance
$354,274
Interest Rate
3.3%
Mortgage Type
FHA
Estimated Equity
$474,331
Purchase Details
Closed on
Apr 28, 2005
Sold by
Castellano Joseph
Bought by
Fried Susan
Home Financials for this Owner
Home Financials are based on the most recent Mortgage that was taken out on this home.
Original Mortgage
$468,000
Interest Rate
6.01%
Purchase Details
Closed on
Mar 31, 2000
Sold by
15 Wakelee Drive Corp
Bought by
Castellano Joseph and Castellano Christine
Home Financials for this Owner
Home Financials are based on the most recent Mortgage that was taken out on this home.
Original Mortgage
$160,000
Interest Rate
8.26%
Create a Home Valuation Report for This Property
The Home Valuation Report is an in-depth analysis detailing your home's value as well as a comparison with similar homes in the area
Home Values in the Area
Average Home Value in this Area
Purchase History
| Date | Buyer | Sale Price | Title Company |
|---|---|---|---|
| Roy Deepanjan | $475,000 | Wfg National Title | |
| Fried Susan | $585,000 | -- | |
| Castellano Joseph | $240,000 | -- |
Source: Public Records
Mortgage History
| Date | Status | Borrower | Loan Amount |
|---|---|---|---|
| Open | Roy Deepanjan | $466,396 | |
| Previous Owner | Fried Susan | $468,000 | |
| Previous Owner | Castellano Joseph | $160,000 |
Source: Public Records
Tax History Compared to Growth
Tax History
| Year | Tax Paid | Tax Assessment Tax Assessment Total Assessment is a certain percentage of the fair market value that is determined by local assessors to be the total taxable value of land and additions on the property. | Land | Improvement |
|---|---|---|---|---|
| 2025 | $17,813 | $709,700 | $281,100 | $428,600 |
| 2024 | $17,375 | $438,200 | $150,900 | $287,300 |
| 2023 | $17,015 | $438,200 | $150,900 | $287,300 |
| 2022 | $17,015 | $438,200 | $150,900 | $287,300 |
| 2021 | $16,932 | $438,200 | $150,900 | $287,300 |
| 2020 | $16,472 | $438,200 | $150,900 | $287,300 |
| 2019 | $16,078 | $438,200 | $150,900 | $287,300 |
| 2018 | $15,749 | $438,200 | $150,900 | $287,300 |
| 2017 | $15,447 | $438,200 | $150,900 | $287,300 |
| 2016 | $15,087 | $438,200 | $150,900 | $287,300 |
| 2015 | $14,741 | $438,200 | $150,900 | $287,300 |
| 2014 | $14,452 | $438,200 | $150,900 | $287,300 |
Source: Public Records
Map
Nearby Homes
- 122 W Quackenbush Ave
- 27A Park Ave
- 9 New York Ave
- 22 W Central Ave
- 136 W Central Ave
- 155 Johnson Ave
- 56 Sergent Ct
- 32 1st St
- 62 Prospect Ave
- 131 N Prospect Ave
- 18 Carlisle St
- 83 N Washington Ave
- 25 Ralph St
- 40 Depew St
- 201 Dixon Ave
- 34 N Washington Ave
- 79 Blauvelt Ave
- 85 Dance Blvd
- 190 Elder Ave
- 19 Bedford Rd
- 14 Locust Ave
- 24 Locust Ave
- 8 Locust Ave
- 28 Locust Ave
- 19 Erie St
- 27 Erie St
- 15 Erie St
- 31 Erie St
- 2 Locust Ave
- 38 Locust Ave
- 35 Erie St
- 60 Columbia Ave Unit 3
- 60 Columbia Ave Unit 15
- 60 Columbia Ave
- 60 Columbia Ave Unit 2
- 60 Columbia Ave Unit 43
- 60 Columbia Ave Unit 23
- 60 Columbia Ave Unit 19
- 60 Columbia Ave Unit 8
- 60 Columbia Ave Unit 44