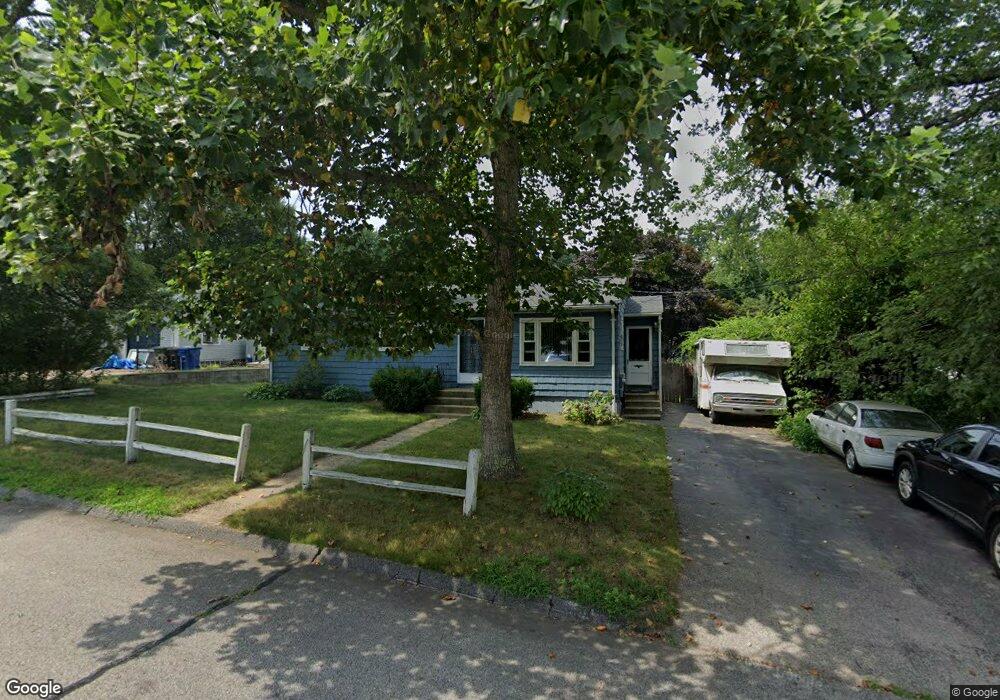
20 Long Pond Rd Coventry, RI 02816
Estimated Value: $360,673 - $365,000
3
Beds
1
Bath
1,012
Sq Ft
$359/Sq Ft
Est. Value
About This Home
This home is located at 20 Long Pond Rd, Coventry, RI 02816 and is currently estimated at $363,168, approximately $358 per square foot. 20 Long Pond Rd is a home located in Kent County with nearby schools including Alan Shawn Feinstein Ms Of Cov, Coventry High School, and Father John V. Doyle School.
Ownership History
Date
Name
Owned For
Owner Type
Purchase Details
Closed on
Jun 21, 2000
Sold by
Sherman Cindy L
Bought by
Hogan Brian M
Current Estimated Value
Home Financials for this Owner
Home Financials are based on the most recent Mortgage that was taken out on this home.
Original Mortgage
$80,000
Interest Rate
8.48%
Purchase Details
Closed on
May 13, 1992
Sold by
Dube Robert
Bought by
Sherman Steven
Home Financials for this Owner
Home Financials are based on the most recent Mortgage that was taken out on this home.
Original Mortgage
$102,500
Interest Rate
8.89%
Create a Home Valuation Report for This Property
The Home Valuation Report is an in-depth analysis detailing your home's value as well as a comparison with similar homes in the area
Purchase History
| Date | Buyer | Sale Price | Title Company |
|---|---|---|---|
| Hogan Brian M | $100,000 | -- | |
| Sherman Steven | $108,000 | -- |
Source: Public Records
Mortgage History
| Date | Status | Borrower | Loan Amount |
|---|---|---|---|
| Open | Sherman Steven | $110,000 | |
| Closed | Sherman Steven | $83,000 | |
| Closed | Sherman Steven | $80,000 | |
| Previous Owner | Sherman Steven | $102,500 |
Source: Public Records
Tax History
| Year | Tax Paid | Tax Assessment Tax Assessment Total Assessment is a certain percentage of the fair market value that is determined by local assessors to be the total taxable value of land and additions on the property. | Land | Improvement |
|---|---|---|---|---|
| 2025 | $3,947 | $245,300 | $91,000 | $154,300 |
| 2024 | $3,886 | $245,300 | $91,000 | $154,300 |
| 2023 | $3,760 | $245,300 | $91,000 | $154,300 |
| 2022 | $3,814 | $194,900 | $89,400 | $105,500 |
| 2021 | $3,781 | $194,900 | $89,400 | $105,500 |
| 2020 | $4,335 | $194,900 | $89,400 | $105,500 |
| 2019 | $3,398 | $152,800 | $62,100 | $90,700 |
| 2018 | $3,302 | $152,800 | $62,100 | $90,700 |
| 2017 | $3,206 | $152,800 | $62,100 | $90,700 |
| 2016 | $2,880 | $134,500 | $58,200 | $76,300 |
| 2015 | $2,802 | $134,500 | $58,200 | $76,300 |
| 2014 | $2,743 | $134,500 | $58,200 | $76,300 |
| 2013 | $2,806 | $150,400 | $62,700 | $87,700 |
Source: Public Records
Map
Nearby Homes
- 168 Knotty Oak Rd
- 9 Regent St Unit 11
- 31 Anthony St Unit 33
- 27 Matteson St
- 4 Pearl St
- 37 Holden St
- 33-35 Holden St
- 69 Station St
- 2 Fairway Dr
- 33 Holden St Unit 35
- 78 Gervais St
- 175 Gervais St
- 123 Doolittle St
- 0 Beaulieu Ave
- 77 Macarthur Blvd
- 17 Jurczyk Ct
- 9 Jurczyk Ct
- 1205 Main St
- 18 S Main St
- 87 Bates Ave
Your Personal Tour Guide
Ask me questions while you tour the home.