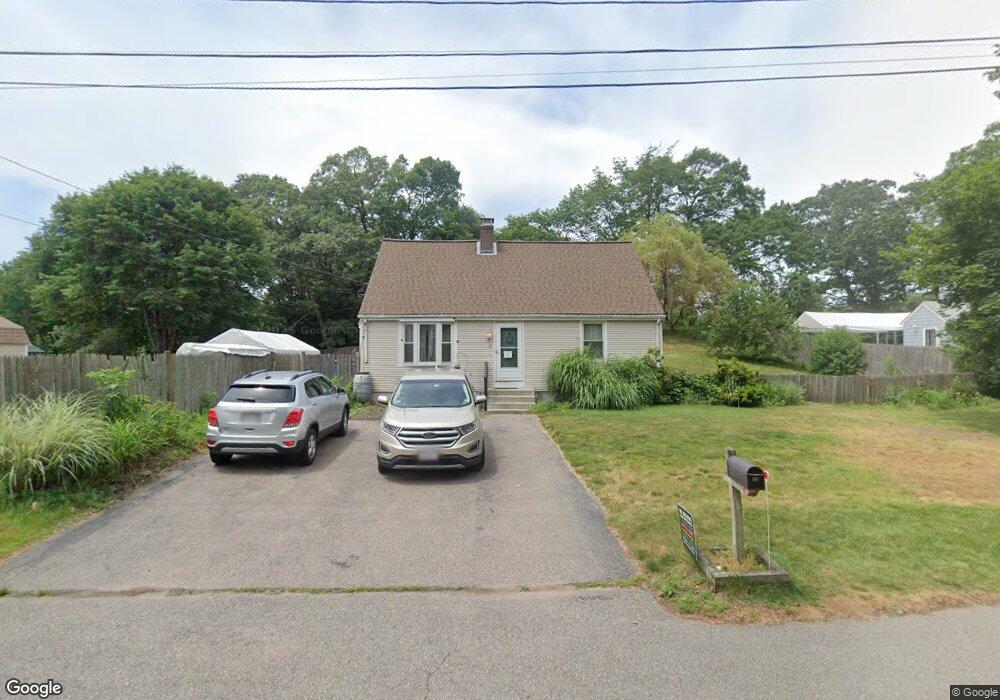
20 Loomis St Attleboro, MA 02703
Estimated Value: $488,000 - $544,000
4
Beds
2
Baths
1,630
Sq Ft
$317/Sq Ft
Est. Value
About This Home
This home is located at 20 Loomis St, Attleboro, MA 02703 and is currently estimated at $516,737, approximately $317 per square foot. 20 Loomis St is a home located in Bristol County with nearby schools including Hill-Roberts Elementary School, Robert J. Coelho Middle School, and Attleboro High School.
Ownership History
Date
Name
Owned For
Owner Type
Purchase Details
Closed on
Aug 14, 2007
Sold by
Pfeil Gerard and Slm Fncl Corp
Bought by
Sallie Mae Home Loans
Current Estimated Value
Purchase Details
Closed on
Sep 8, 1999
Sold by
Storey Howard A and Storey Carol A
Bought by
Pfeil Gerard and Pfeil Lori
Purchase Details
Closed on
Nov 5, 1998
Sold by
Storey Howard A and Bank Of New York
Bought by
Bank Of New York
Create a Home Valuation Report for This Property
The Home Valuation Report is an in-depth analysis detailing your home's value as well as a comparison with similar homes in the area
Home Values in the Area
Average Home Value in this Area
Purchase History
| Date | Buyer | Sale Price | Title Company |
|---|---|---|---|
| Sallie Mae Home Loans | $239,000 | -- | |
| Pfeil Gerard | $20,000 | -- | |
| Bank Of New York | $99,025 | -- |
Source: Public Records
Mortgage History
| Date | Status | Borrower | Loan Amount |
|---|---|---|---|
| Open | Bank Of New York | $198,412 |
Source: Public Records
Tax History Compared to Growth
Tax History
| Year | Tax Paid | Tax Assessment Tax Assessment Total Assessment is a certain percentage of the fair market value that is determined by local assessors to be the total taxable value of land and additions on the property. | Land | Improvement |
|---|---|---|---|---|
| 2025 | $5,266 | $419,600 | $139,700 | $279,900 |
| 2024 | $5,089 | $399,800 | $139,700 | $260,100 |
| 2023 | $4,756 | $347,400 | $127,000 | $220,400 |
| 2022 | $4,491 | $310,800 | $121,000 | $189,800 |
| 2021 | $4,291 | $289,900 | $116,500 | $173,400 |
| 2020 | $4,096 | $281,300 | $113,100 | $168,200 |
| 2019 | $3,825 | $270,100 | $111,000 | $159,100 |
| 2018 | $3,444 | $245,300 | $107,700 | $137,600 |
| 2017 | $3,520 | $241,900 | $107,700 | $134,200 |
| 2016 | $3,425 | $231,100 | $105,800 | $125,300 |
Source: Public Records
Map
Nearby Homes