20 Lucille St Providence, RI 02908
Elmhurst NeighborhoodEstimated Value: $387,000 - $412,000
3
Beds
1
Bath
1,644
Sq Ft
$242/Sq Ft
Est. Value
About This Home
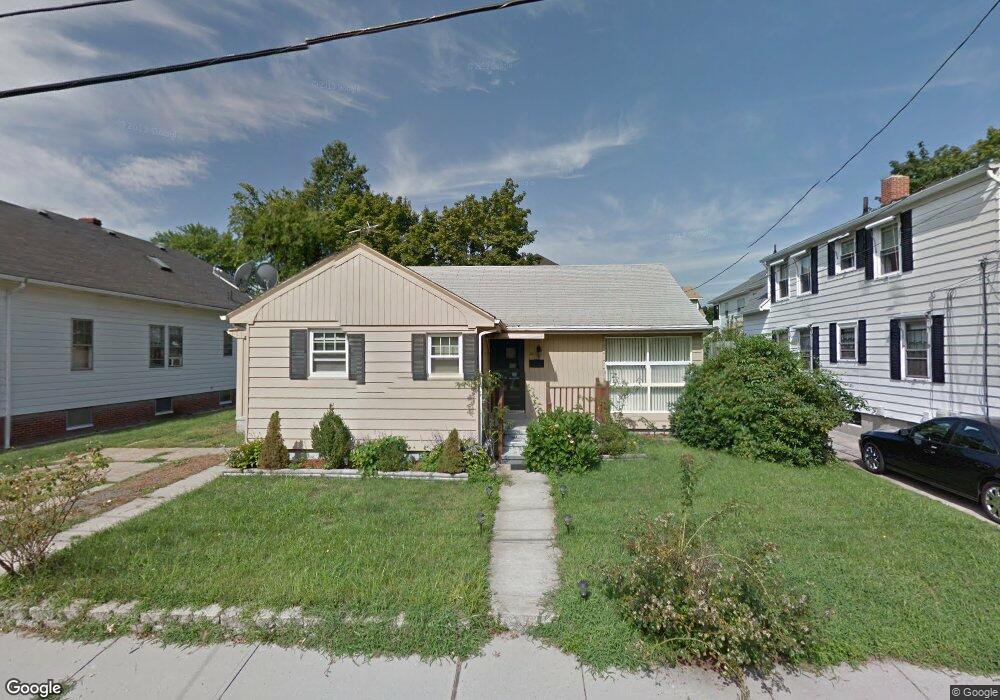
This home is located at 20 Lucille St, Providence, RI 02908 and is currently estimated at $398,403, approximately $242 per square foot. 20 Lucille St is a home located in Providence County with nearby schools including Asa Messer Elementary School, Charles N. Fortes Elementary School, and Veazie Street Elementary School.
Ownership History
Date
Name
Owned For
Owner Type
Purchase Details
Closed on
Oct 24, 2005
Sold by
Hayhow Carol A P and Pugliese Julia Amelia
Bought by
Estrada Carlos and Estrada Claudia
Current Estimated Value
Home Financials for this Owner
Home Financials are based on the most recent Mortgage that was taken out on this home.
Original Mortgage
$180,000
Interest Rate
5.72%
Mortgage Type
Purchase Money Mortgage
Create a Home Valuation Report for This Property
The Home Valuation Report is an in-depth analysis detailing your home's value as well as a comparison with similar homes in the area
Home Values in the Area
Average Home Value in this Area
Purchase History
| Date | Buyer | Sale Price | Title Company |
|---|---|---|---|
| Estrada Carlos | $225,000 | -- |
Source: Public Records
Mortgage History
| Date | Status | Borrower | Loan Amount |
|---|---|---|---|
| Open | Estrada Carlos | $231,000 | |
| Closed | Estrada Carlos | $180,000 | |
| Closed | Estrada Carlos | $45,000 | |
| Previous Owner | Estrada Carlos | $35,000 |
Source: Public Records
Tax History Compared to Growth
Tax History
| Year | Tax Paid | Tax Assessment Tax Assessment Total Assessment is a certain percentage of the fair market value that is determined by local assessors to be the total taxable value of land and additions on the property. | Land | Improvement |
|---|---|---|---|---|
| 2025 | $2,768 | $329,500 | $161,000 | $168,500 |
| 2024 | $4,578 | $249,500 | $104,600 | $144,900 |
| 2023 | $4,578 | $249,500 | $104,600 | $144,900 |
| 2022 | $4,441 | $249,500 | $104,600 | $144,900 |
| 2021 | $4,576 | $186,300 | $81,500 | $104,800 |
| 2020 | $4,576 | $186,300 | $81,500 | $104,800 |
| 2019 | $4,504 | $183,400 | $81,500 | $101,900 |
| 2018 | $4,573 | $143,100 | $65,500 | $77,600 |
| 2017 | $4,573 | $143,100 | $65,500 | $77,600 |
| 2016 | $4,573 | $143,100 | $65,500 | $77,600 |
| 2015 | $3,859 | $116,600 | $65,500 | $51,100 |
| 2014 | $3,935 | $116,600 | $65,500 | $51,100 |
| 2013 | $3,935 | $116,600 | $65,500 | $51,100 |
Source: Public Records
Map
Nearby Homes