Estimated Value: $296,095 - $310,000
3
Beds
2
Baths
1,310
Sq Ft
$232/Sq Ft
Est. Value
About This Home
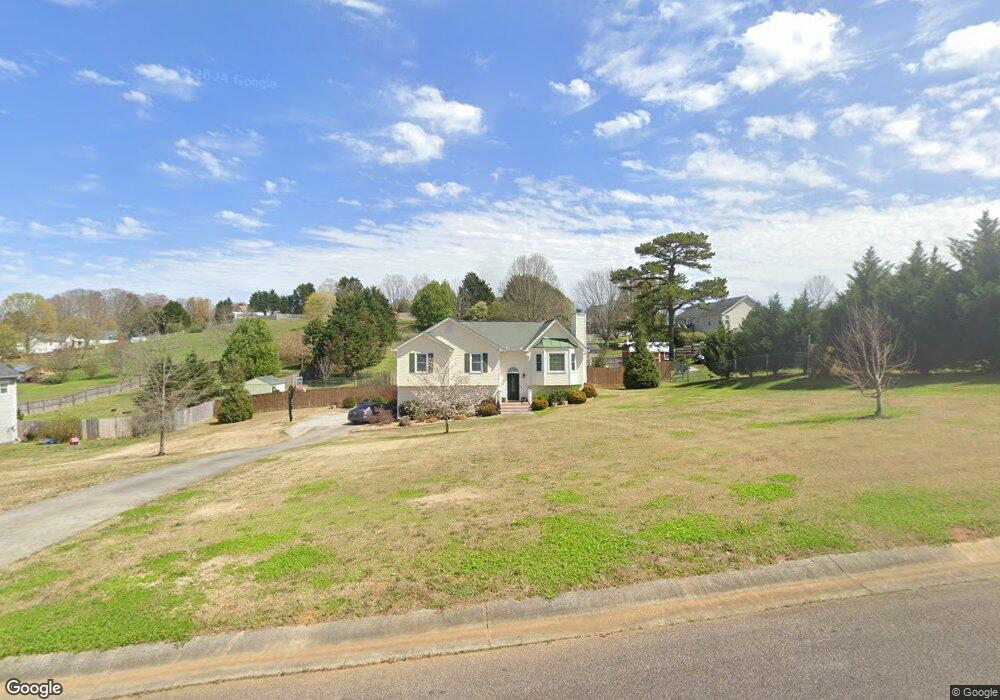
This home is located at 20 Magnolia Ct NE, Rydal, GA 30171 and is currently estimated at $303,274, approximately $231 per square foot. 20 Magnolia Ct NE is a home located in Bartow County with nearby schools including Pine Log Elementary School, Adairsville Middle School, and Adairsville High School.
Ownership History
Date
Name
Owned For
Owner Type
Purchase Details
Closed on
Jul 22, 2013
Sold by
Smith Brandie N
Bought by
Smith Brandie N and Smith Gabriel L
Current Estimated Value
Home Financials for this Owner
Home Financials are based on the most recent Mortgage that was taken out on this home.
Original Mortgage
$124,020
Outstanding Balance
$90,333
Interest Rate
3.96%
Mortgage Type
FHA
Estimated Equity
$212,941
Purchase Details
Closed on
May 18, 2007
Sold by
J A Davis Properties Inc
Bought by
Norwood Brandie H
Home Financials for this Owner
Home Financials are based on the most recent Mortgage that was taken out on this home.
Original Mortgage
$134,337
Interest Rate
6.12%
Mortgage Type
New Conventional
Purchase Details
Closed on
Apr 24, 2006
Sold by
Jpmorgan Chase Bank
Bought by
J A Davis Properties Inc
Purchase Details
Closed on
Jan 3, 2006
Sold by
Mooney Joey E
Bought by
Jpmorgan Chase Bank
Create a Home Valuation Report for This Property
The Home Valuation Report is an in-depth analysis detailing your home's value as well as a comparison with similar homes in the area
Home Values in the Area
Average Home Value in this Area
Purchase History
| Date | Buyer | Sale Price | Title Company |
|---|---|---|---|
| Smith Brandie N | -- | -- | |
| Smith Brandie N | -- | -- | |
| Norwood Brandie H | $135,900 | -- | |
| J A Davis Properties Inc | $96,000 | -- | |
| Jpmorgan Chase Bank | $125,085 | -- |
Source: Public Records
Mortgage History
| Date | Status | Borrower | Loan Amount |
|---|---|---|---|
| Open | Smith Brandie N | $124,020 | |
| Closed | Smith Brandie N | $124,020 | |
| Previous Owner | Norwood Brandie H | $134,337 |
Source: Public Records
Tax History Compared to Growth
Tax History
| Year | Tax Paid | Tax Assessment Tax Assessment Total Assessment is a certain percentage of the fair market value that is determined by local assessors to be the total taxable value of land and additions on the property. | Land | Improvement |
|---|---|---|---|---|
| 2024 | $2,429 | $101,015 | $19,200 | $81,815 |
| 2023 | $2,455 | $94,891 | $19,200 | $75,691 |
| 2022 | $2,030 | $79,946 | $16,000 | $63,946 |
| 2021 | $1,678 | $62,917 | $14,000 | $48,917 |
| 2020 | $1,728 | $62,917 | $14,000 | $48,917 |
| 2019 | $1,509 | $54,366 | $10,000 | $44,366 |
| 2018 | $1,486 | $53,328 | $10,000 | $43,328 |
| 2017 | $1,493 | $53,328 | $10,000 | $43,328 |
| 2016 | $1,293 | $45,840 | $6,000 | $39,840 |
| 2015 | $1,186 | $41,960 | $6,000 | $35,960 |
| 2014 | $1,149 | $39,360 | $4,800 | $34,560 |
| 2013 | -- | $37,240 | $8,000 | $29,240 |
Source: Public Records
Map
Nearby Homes
- 122 Palisade Dr
- 0 Cherokee Hills Dr Unit 7323862
- 0 Cherokee Hills Dr Unit 129186
- 157 Palisade Dr NE
- 104 E Valley Rd NE
- 300 Eminence Peak
- 301 Eminence Peak
- 151 Palisade Dr
- 34 E Heritage Dr NE
- 19 Four Feathers Ln NE
- 13 Four Feathers Ln NE
- 44 E Heritage Dr NE
- 3785 Hwy 140 NE
- 3789 Hwy 140 NE
- 23 Indian Hills Dr
- 3793 Hwy 140 NE
- 3805 Hwy 140 NE
- 3797 Hwy 140 NE
- 3801 Hwy 140 NE
- 64 N Village Cir
- 22 Magnolia Ct NE
- 22 Magnolia Ct
- 11 Moriah Way NE
- 13 Moriah Way NE
- 24 Magnolia Ct NE
- 21 Magnolia Ct NE
- 17 Moriah Way NE
- 23 Magnolia Ct NE Unit ID1234826P
- 23 Magnolia Ct NE
- 10 Moriah Way NE
- 10 Moriah Way NE Unit 49
- 19 Moriah Way NE
- 17 Magnolia Ct NE
- 30 Magnolia Ct NE
- 25 Magnolia Ct NE
- 34 Magnolia Ct NE
- 21 Moriah Way NE
- 14 Moriah Way NE
- 27 Magnolia Ct NE
- 36 Magnolia Ct NE