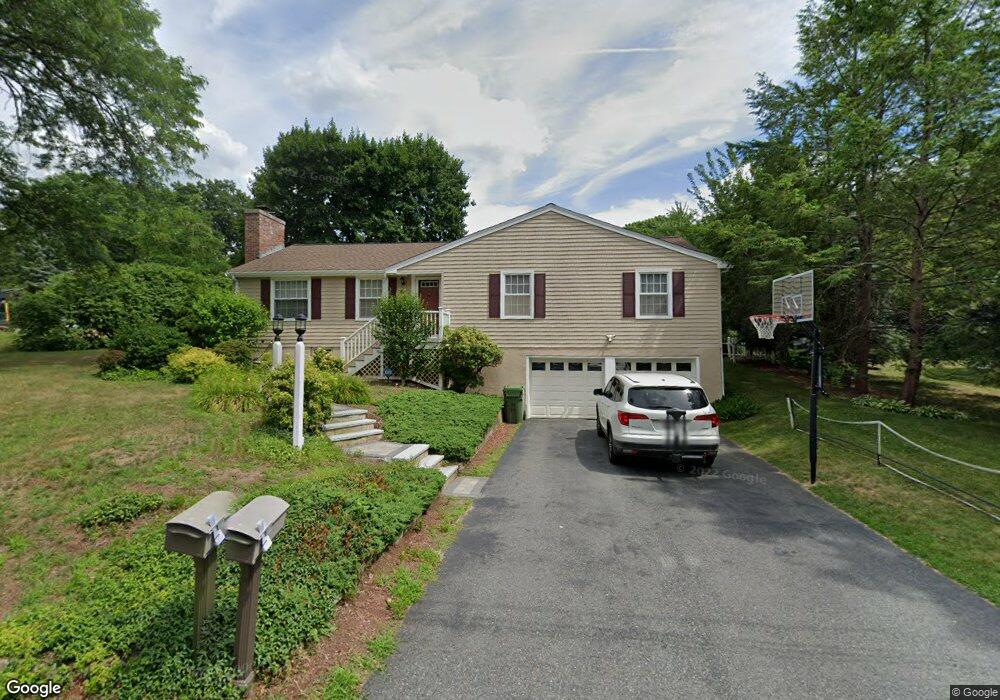
20 Maguire Rd Wayland, MA 01778
Estimated Value: $889,445 - $1,020,000
4
Beds
2
Baths
1,848
Sq Ft
$527/Sq Ft
Est. Value
About This Home
This home is located at 20 Maguire Rd, Wayland, MA 01778 and is currently estimated at $973,861, approximately $526 per square foot. 20 Maguire Rd is a home located in Middlesex County with nearby schools including Wayland High School and Veritas Christian Academy.
Ownership History
Date
Name
Owned For
Owner Type
Purchase Details
Closed on
Oct 31, 2024
Sold by
Ozpeynirci Bilgehan
Bought by
Bilgehan Ozpeynirci Lt and Ozpeynirci
Current Estimated Value
Purchase Details
Closed on
Sep 14, 2007
Sold by
Ching-Hsuan Wu Ayong and Ching-Hsuan Tung
Bought by
Ozpeynirci Bilgehan
Home Financials for this Owner
Home Financials are based on the most recent Mortgage that was taken out on this home.
Original Mortgage
$391,000
Interest Rate
6.7%
Mortgage Type
Purchase Money Mortgage
Purchase Details
Closed on
Jul 5, 2000
Sold by
Phoenix Wayne G and Phoenix Linda E
Bought by
Tung Ching-Hsuan and Wu Ayong
Create a Home Valuation Report for This Property
The Home Valuation Report is an in-depth analysis detailing your home's value as well as a comparison with similar homes in the area
Home Values in the Area
Average Home Value in this Area
Purchase History
| Date | Buyer | Sale Price | Title Company |
|---|---|---|---|
| Bilgehan Ozpeynirci Lt | -- | None Available | |
| Bilgehan Ozpeynirci Lt | -- | None Available | |
| Bilgehan Ozpeynirci Lt | -- | None Available | |
| Ozpeynirci Bilgehan | $521,000 | -- | |
| Ozpeynirci Bilgehan | $521,000 | -- | |
| Tung Ching-Hsuan | $384,000 | -- |
Source: Public Records
Mortgage History
| Date | Status | Borrower | Loan Amount |
|---|---|---|---|
| Previous Owner | Tung Ching-Hsuan | $388,000 | |
| Previous Owner | Ozpeynirci Bilgehan | $391,000 |
Source: Public Records
Tax History Compared to Growth
Tax History
| Year | Tax Paid | Tax Assessment Tax Assessment Total Assessment is a certain percentage of the fair market value that is determined by local assessors to be the total taxable value of land and additions on the property. | Land | Improvement |
|---|---|---|---|---|
| 2025 | $11,257 | $720,200 | $402,700 | $317,500 |
| 2024 | $10,651 | $686,300 | $383,500 | $302,800 |
| 2023 | $10,330 | $620,400 | $348,700 | $271,700 |
| 2022 | $9,324 | $508,100 | $288,700 | $219,400 |
| 2021 | $8,891 | $480,100 | $262,400 | $217,700 |
| 2020 | $8,527 | $480,100 | $262,400 | $217,700 |
| 2019 | $8,431 | $461,200 | $250,000 | $211,200 |
| 2018 | $8,411 | $466,500 | $250,000 | $216,500 |
| 2017 | $8,241 | $454,300 | $238,100 | $216,200 |
| 2016 | $7,796 | $449,600 | $233,400 | $216,200 |
| 2015 | $8,268 | $449,600 | $233,400 | $216,200 |
Source: Public Records
Map
Nearby Homes